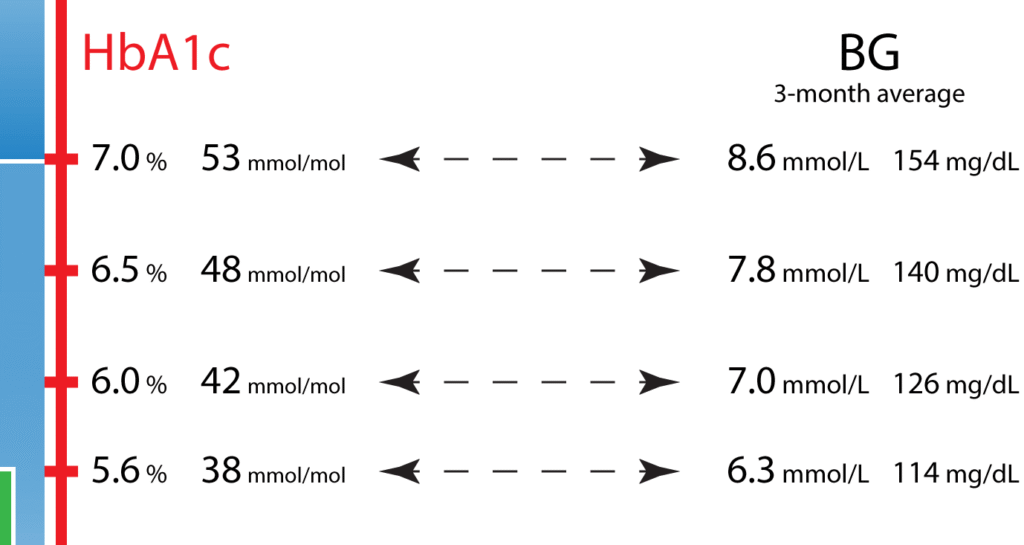
David Burren

HbA1c graphic

Here’s a graphic for you to use as a quick-reference guide to put HbA1c numbers into context, and show the relationships between HbA1c, Blood Glucose, and GMI. Unlike many of the “A1c chart” graphics that have been doing the rounds over the years, I’ve tried to strike a compromise between too-little and too-much information. I’ve …

HbA1c graphic Read More »

Graph of David's total insulin use.

Using “bigger” data

When making changes to our diabetes management we sometimes see changes in our total insulin consumption. And it’s easy to jump to conclusions regarding cause and effect. Whether it’s a new insulin, a different diet, a new adjunctive treatment, changes to exercise and body composition, or whatever. It’s easy for example to look at the …

Using “bigger” data Read More »