Talk of “Time in Range” and goal ranges regarding BG and CGM data is a common thing these days. I have written about Targets and Goals in the past.
Various different pieces of software let you define your “low” and “high” marks to define your goal range, and then report statistics on what percentage of TiR you’re achieving.
And yet there’s some inconsistency in the way these goalposts are defined.
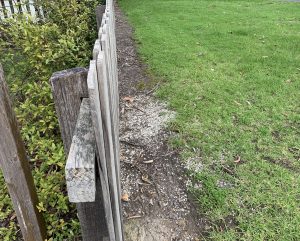
Which side of the fencepost is the boundary?
 What happens when you get a BG value the same as the low boundary? Is it counted as low or as in-range? And the same goes for the high boundary.
I have my systems set to show in-range readings as one colour (e.g. green) and out-of-range as another (e.g. yellow or red). But it’s disconcerting when different pieces of software show different colours for the same reading! So sometimes I’ve had to tweak the range definitions.
In the following examples I’m using 3.9-7.8 mmol/L as my goal range. I want anything from 3.9 to 7.8 regarded as in-range, but 3.8 or 7.9 as out-of-range. To make everything consistent I’ve had to set different boundaries in different software.
| Software | Low-high to achieve 3.9-7.8 | |
|---|---|---|
| xDrip+ | 3.8-7.8 | 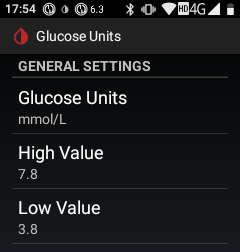 |
| Sugarmate | 3.9-7.9 | 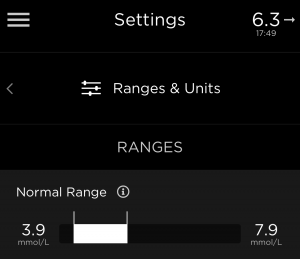 |
| AndroidAPS | 3.8-7.9 | 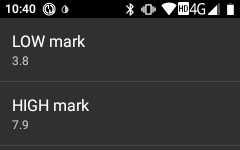 |
| xDrip+/Spike watchface for Garmin | 3.9-7.8 | 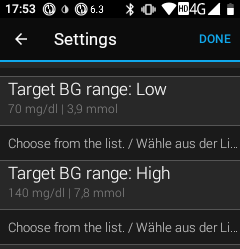 |
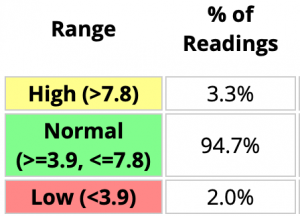 Some software makes it very clear where the boundaries lie. Such as in this example using mathematical expressions such as “<” (less than) and <= (“less than or equal to”).
In most pieces of software you may just need to test it empirically.
Not just pretty colours
It’s not just the colour of the number on the screen or the dots on the graph that can be affected by this. It can also affect the statistics we look at when gauging our progress.
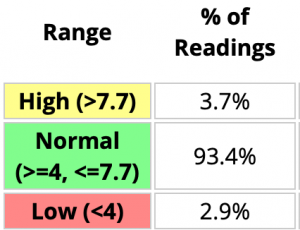 Using the same dataset as the above statistics, just tweaking the boundaries, we can see in this case that 0.9% of the data was at 3.9 mmol/L. Almost half of the time spent below 3.9! At the same time 0.4% of the data was at 7.8.
Being consistent about the boundaries can be important!
Incidentally, the boundaries of 3.9, 7.8, and 10 mmol/L are not completely arbitrary. Well, they are in that they match the boundaries of 70, 140, and 180 mg/dL used in a lot of studies.
Nice article David, time to tweak settings to get consistency.
Hello David,
Please be careful with your error ranges here, the readings can be 10% off ie 3.9mmol/L could be an actual blood sugar of 3.5mmol
Thanks
Indeed. An earlier article on this site: Do you trust your meter?
edit – somehow deleted part of my first sentence, should be:
Hopefully no-one has made the rookie error of not defining one side of the boundary as = (such that neither range includes the boundary value itself), or the alternative of defining ranges on both sides of a boundary with “between” (such that the boundary values is included in BOTH ranges). I’ve not looked at the code of any diabetes apps but I’ve certainly come across both the errors above many times (sometimes in my own work :()