
BG meters are not accurate: they’re allowed to not report your actual BG value. Shocking, but true.
Many people use a single meter, and assume that the number reported is their actual BG value. And then when they use a CGM (or a Libre) they complain that the numbers from those devices don’t match their meter. But where does the error lie? In the meter or the CGM?
In both of course!
The ISO 15197:2013 standard (which meter manufacturers needed to comply with by mid-2016) allows meters to be off by 15%. Actually, the standard also specifies that below 5.6 mmol/l the allowed error is +/- 0.83 mmol/l. If you’re somewhere that works in mg/dl instead, just multiply these values by 18.
So if your BG was 10 mmol/l, your meter is allowed to report anything from 8.5 to 11.5 mmol/l.
If it was actually 3.0 mmol/l, the meter is allowed to report between 2.2 and 3.8 mmol/l.
If your meter reported a value of 15.0 mmol/l, that means that your actual BG value should be somewhere between 12.8-17.3 mmol/l!
And so on.
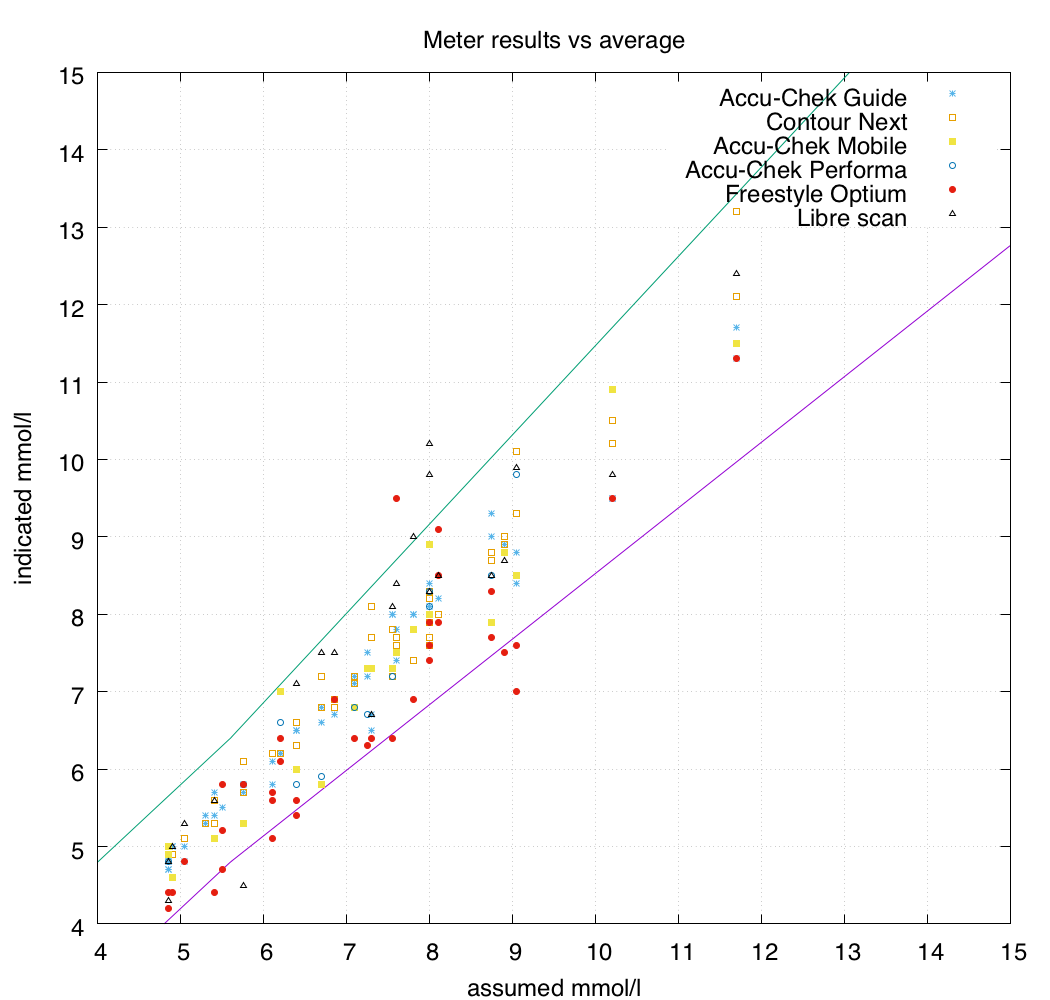
If we look at these numbers in a graph along with some actual results from a BG meter it might make sense:
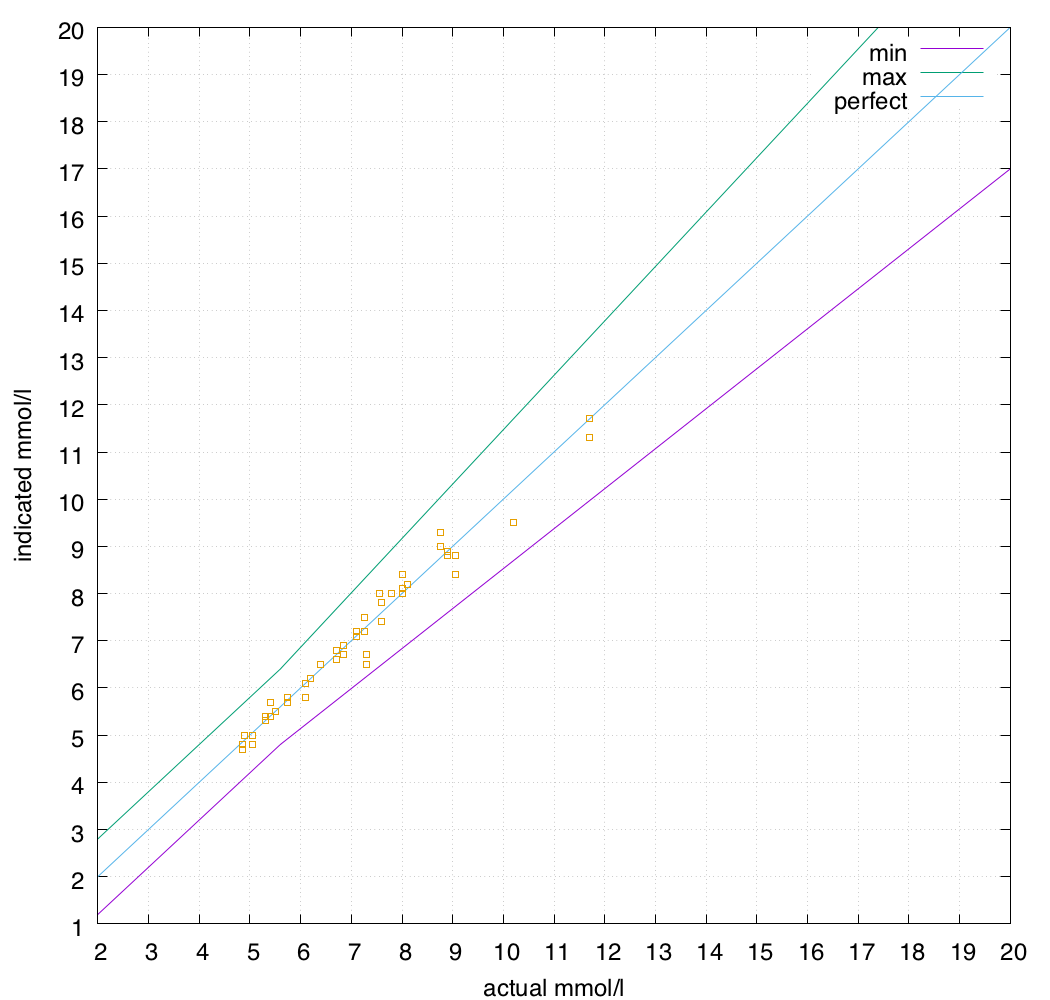
As you can see, the meter doesn’t always report the same value for the same blood. Ideally they would be as close as possible to that centre “perfect” line, but they will vary.
In fact the standard says the meters only have to report values within the highlighted band 95% of the time. So one time out of 20 it can also report values outside this band!
All these error percentages seem very theoretical, until you start testing drops of blood with more than one meter. Even meters of the same model. Then you become very aware of the fact that your meter’s idea of reality can vary.
Time to do some testing!
I manage my Type 1 diabetes with a closed-loop pump system which relies on the values being reported by my CGM, and the CGM is dependent on calibration from BG meters, so I wanted to check on the meters I was using. I have multiple meters (e.g. one beside the bed, one in the kitchen, one in my satchel, etc) and had noticed that sometimes if I used one meter the calibrated CGM would kick up a few mmol/l, then drop down again the next time I calibrated with a different meter. So it was time to doublecheck.
I specifically wanted to compare the Contour Next and Accu-Chek Guide meters, so over 3 weeks in June 2018 I tested them together. But I also threw other meters into the mix to compare at the same time.
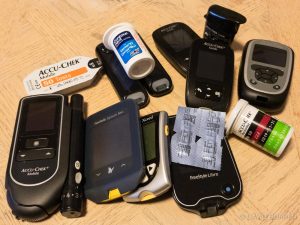 I collected all the meters I had in the house, and it ended up being a sizeable collection. I had Accu-Chek Guides, Performa Combos, Mobiles, Contour Next Ones, Abbott Freestyle Optium Xceed and Neo, and Freestyle Libre Readers.
These different meters have different features. For example, the Optium meters can also use ketone test strips. The Guide and Next One meters have LEDs to light the test strip for testing in the dark (as well as Bluetooth to upload results to a phone), the Mobile is integrated and convenient (and can be used one-handed), the Libre Reader also acts as a scanner for Libre sensors, etc.
But most of the BG testing technology is in the test strips, and meters that use the same strips typically produce consistent results. Independent tests (e.g. from Diabetes Technology Society, Integrated Diabetes Services) have shown the Contour Next strips to be very accurate. The Accu-Chek Guide strips claim a high accuracy too, and my experience with them over the last year has borne this out.
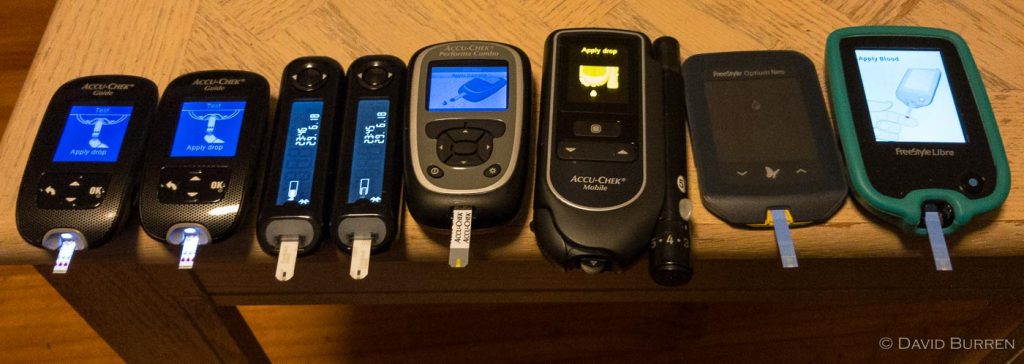
At each blood test I would arrange all the meters in a line, produce one large drop of blood on my finger, and use that to feed all the meters. And within a minute also use the Libre Reader to scan the sensor in my arm. Not all meters were tested every time, but from 4 to 9 meters were used each time. All strips were well within their expiry dates.
All tests that included a Libre scan were done while the Libre indicated a “flat” trend of no change in glucose value, so blood vs interstital fluid “lag” effects should not be relevant. I was using the results of these tests to calibrate my Dexcom CGM, where lag effects needed to be avoided.
| BG test strip | Number of samples | notes |
|---|---|---|
| Contour Next | 52 | These strips are used by Bayer/Medtronic meters. I used two Contour Next One meters, mixed with strips from two batches. |
| Accu-Chek Guide | 57 | Two meters used. Multiple strip batches used. |
| Accu-Chek Mobile | 22 | One meter and one cartridge used. |
| Freestyle Optium | 38 | Libre Reader, Optium Neo, and Xceed used. Two strip batches used. |
| Accu-Chek Performa | 12 | One Performa Combo used with one batch of strips. |
| Libre scan | 22 | One sensor used. |
I do not have access to a laboratory-standard YSI glucose analyser, so how do I know what each meter is actually measuring? The approximation I had to settle for was to compare it to the results of all the other BG meters in the hope that this somehow approximates reality.
At each sample, the results of the different meters were averaged together to provide an “assumed actual” value. The Libre scans were not included in this calculation.
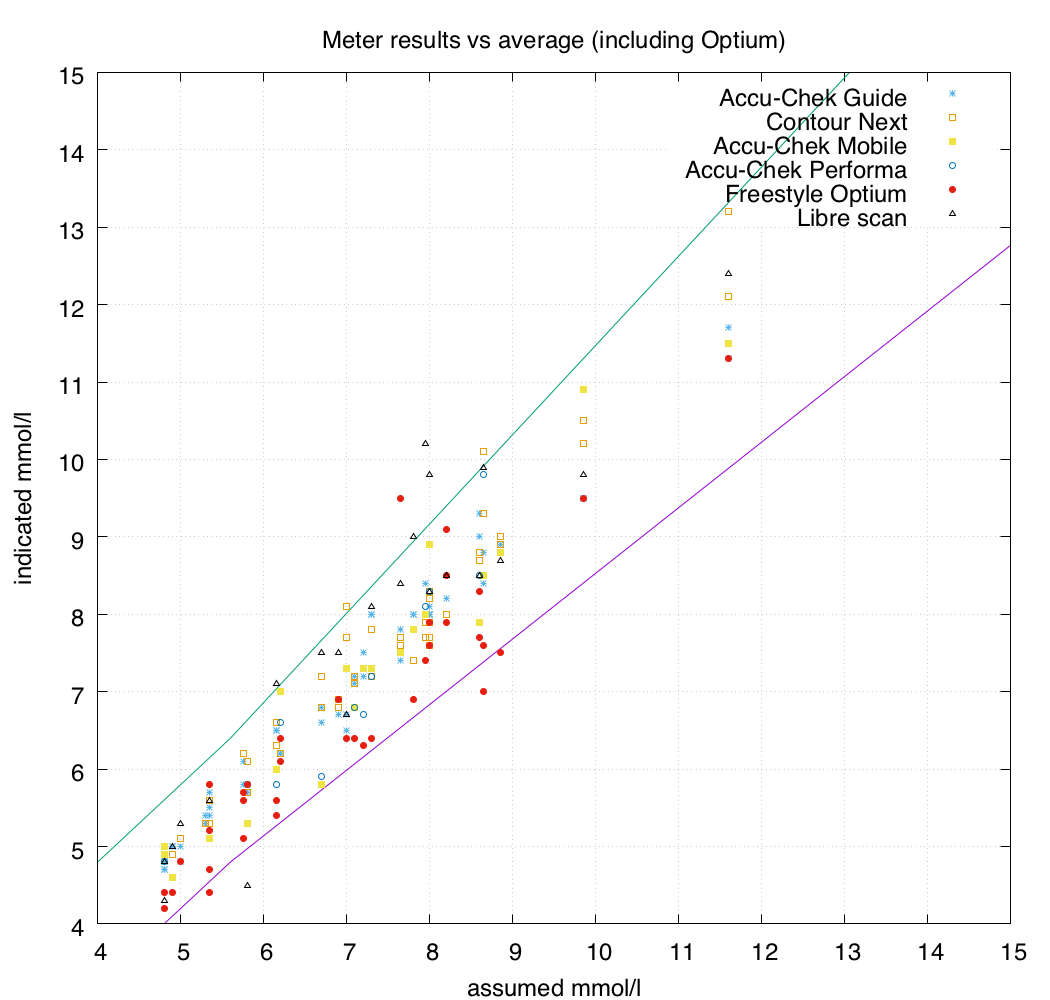
Note that in these tests no meter reported a value lower than 4.2 mmol/l. A more-complete test might also examine the variation between meters in hypoglycaemic territory, but my closed-loop system tends to keep me out of that range. Thus most of the results were in the 5-9 range. I wasn’t aiming at specific ranges to test: just whenever the conditions were right to do a test and I was near the desk with all these meters laid out, I’d sit down and add another line of data into the spreadsheet.
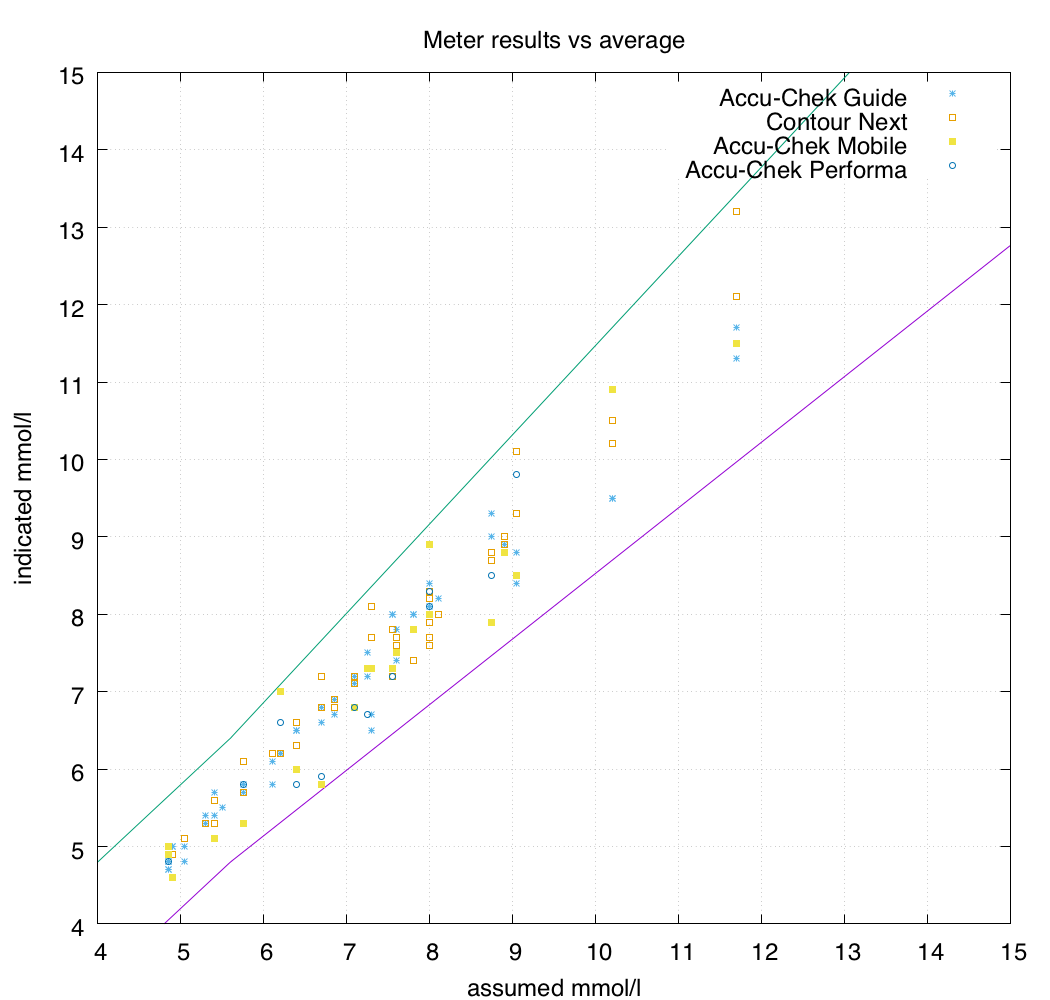
You can see on the graph that the Freestyle Optium strips seemed to have a lot more variance than the other meters, so I then removed them from the calculation of the “assumed actual” values.
As a result the graph changes a bit (with the vertical “strips” of dots moving sideways) and you can see below that now even more of the Optium results fall outside the allowed error range.
The meters I use are mainly the Accu-Chek Guide and Contour Next One models, so I was glad to see that their results are clustered nicely in the centre.
No distinguishing pattern was evident when comparing the results of the Optium Neo, Optium Xceed, and Libre Reader meters. They were using the same strips, and the results seemed consistent (each usually had a high variance from the other meters in the test: none of the three seemed different). These are not huge datasets so there’s not a lot of precision in the statistics we get out of it, but the Optium strips definitely stood out from all the other strips being tested. In these tests (only 38 strips) the Optium strips only managed to be in-range 74% of the time.
All the other BG meters scored 100%.
Interestingly most of the Libre scan results fell within the allowed error range, although less often than the 95% standard BG meters are held to. Only 86% of the Libre scans were in-range.
I expected the Accu-Chek Mobile results to show more variance than they did, which was a pleasant surprise. For many years the the Mobiles were my only meters: I may have developed good testing technique which avoided problems (e.g. if you press or wipe the blood across the sensor strip you can skew the readings, but this wasn’t apparent here).
I use my CGM to feed my closed-loop pump system, so I care about having the CGM report values as close to reality as possible. Thus the meters I use for calibration should be as accurate as possible. A 15% error allowance seems quite large to me: what does it look like if we allowed only a 7% error?
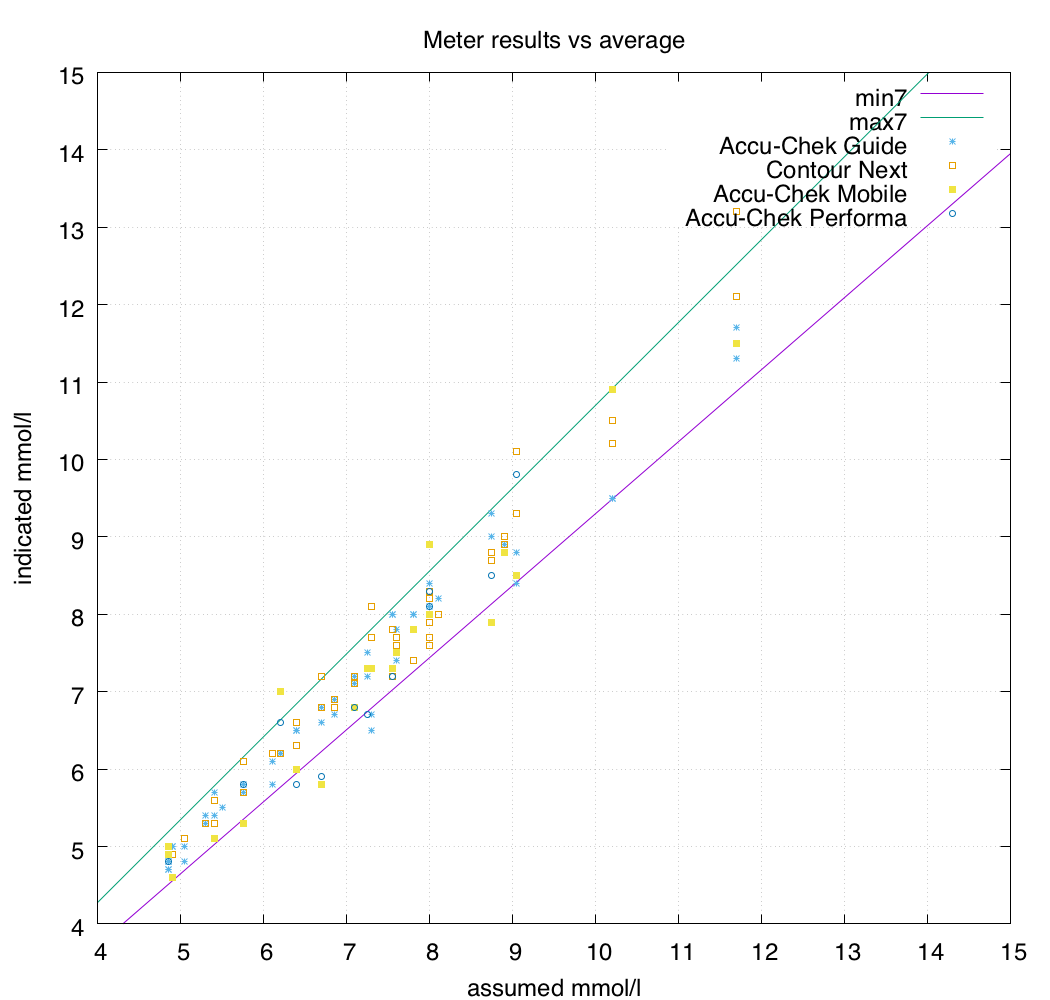
Not too bad. For now I’ll be happily sticking with the Accu-Chek Guide and Contour Next One meters!
This is a very interesting study. I also feel that there sometimes is a vast difference in what the actual reading should be. The allowance that is allowed for the readings in my mind is still too wide since you use it to calibrate other devices to ensure that they are accurate as well. I find that when you check your meter with the test solution, the width of the number range that is allowed seems to be so wide. If you are at the low or the high of the range, what does that mean?
I spent my career in manufacturing and a part of the quality model is statistical process control -SPC and Six sSgma. If we had such a deviation in the manufacturing of hydraulic components for aircraft, we would be out of business. 15% is a Hugh number. 3 sigma is at 99.73%. So where does a 15% allowance leave us?
My experiences with the Libre Sensor and the glucometers that I have have a moderate difference. And as the the readings of the glucometer read a larger number, the error is usually larger. So how does one adjust their dosage of insulin while taking this into account? I think as you mentioned, you find a meter that is repeatable and you use that as the “Golden Standard” and adjust accordingly. The test strips are probably a bigger part of the deviation.
So we will continue to pursue a higher level of accuracy going forward. As a side note, I did find the Contour Next-Bluetooth, to be quite accurate and repeatable.
I’ve had far more consistent results after switching from an Optium Neo to a Contour Next One. Glad to see it’s not just me.
Thank you for sharing your work.
Interesting article. You’re correct in being cautious in how you calibrate your CGM.
DexCom calibrates to that next BG reading. medtronic CGM has a feature to minimize the risk of a poor BG reading. It uses a weighted average of the last 4 calibration BG readings to calculate the calibration factor that will be used until the next calibration BG. Thought you may like to know this
Nothing in diabetes (or for much of human biology) is exact in accuracy or efficacy. If you think BGM and CGM may be inaccurate, just look at what you are using them for – insulin dosage. And insulin varies from 14% efficacy! https://journals.sagepub.com/doi/full/10.1177/1932296817747292?fbclid=IwAR17d0pTmFzcOX-o_3uTPShQRiXbyNyCzY8E-fDJspprcZWQqSzqSErAAdg
Anything we can do to improve the accuracy of any of the components of a system will help. But yes in-accuracies elsewhere can mask the issue.
Note that in Australia the TGA did some similar tests and did not find discrepancies as wide as seen in that US review.
Hi David. Interesting data and in some ways go to confirm what I have thought ever since switching to the Libre Freetstle system. I am wondering if some of the variation can be put down to the Technology in the Freestyle neo and Libre reader because they also able to test for ketones as well which must lead to another layer of complexity. The meters I mentioned both measure both BGL and Ketones and the Libre reader also scans the sensor which measures something that is totally different to BGL as in interstitial fluid which will also give a different reading because of the slight delay in Glucose levels that the Libre Sensor actually measures
Have you read my later Libre accuracy article?