This article is a followup to yesterday’s comments about my last year of using an Automated Insulin Delivery system that has been managing all my food for me. Today I’ll drill down into some insights from the CGM data. I have done similar analyses in the past, but it’s time for a refresh.
My looping timeline
I’ve shown similar graphs before, but this has updated detail.
 There is of course a ton of information there, but displaying it all on one graph makes it easier to see correlations. Breaking it down:
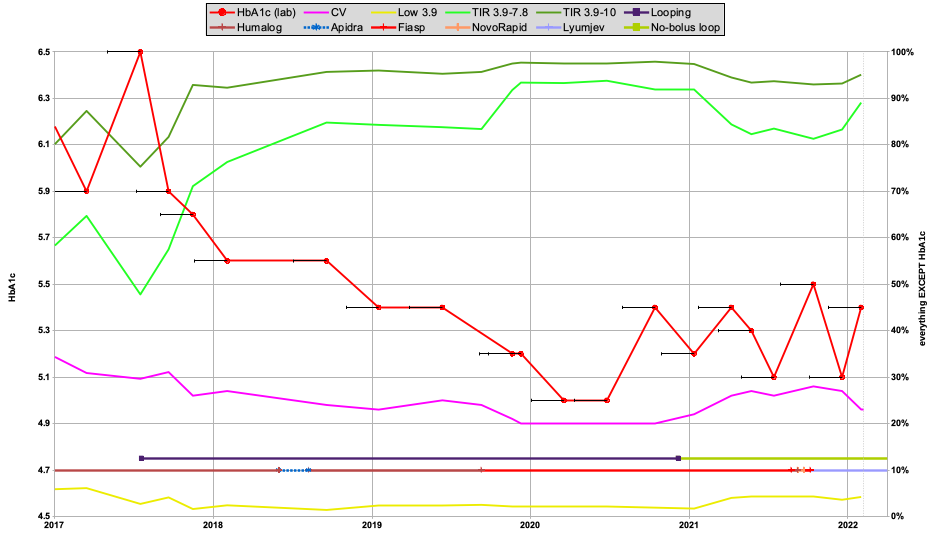
- The axis on the left is for the red HbA1c line showing lab blood tests.
The black bars to the left of each red dot indicate 75 days leading up to that test. These are used for the TIR and CV calculations. - The axis on the right applies to the TIR and CV lines.
- The Coefficient of Variation (purple line) is a measure of how much the BG levels have been varying. Apparently some people without diabetes manage 18%, while recommendations for us are often to try to keep it below 33%.
- Time In Range is calculated for both 3.9-7.8 and 3.9-10 mmol/L (green lines at top).
3.9-10 is the standard clinical range, but 3.9-7.8 is my personal goal range. - Towards the bottom are two horizontal lines:
- You can see when I started looping in 2017, and then stopped bolusing in late 2021.
- The next line shows when I’ve been using different insulins.
- Below that is a yellow line showing the “TBR” (percentage of time spent below 3.9 mmol/L).
I’ll break some of these down further.
Timeline
Here’s the above graph again just for reference.
Starting looping (with OpenAPS) in 2017 had a big impact on my TIR! And it was the first time I’d ever kept my HbA1c below 6%. Gradually things kept improving as I continued to tweak the system.
In late 2019 I switched from Humalog to Fiasp insulin, and it had a noticeable impact. The CV dropped, and the TIR went up (especially for the 3.9-7.8 range which I was targetting by then). My HbA1c continued to drop, and seemed fairly stable at 5.0% in 2020. At this point I was carefully declaring carbs and protein to my system. The protein was being announced as 50% carbs, delayed after ingestion.
Later in 2020 my HbA1c went up, but I wasn’t surprised. I had been doing some experiments with raised target levels in dealing with my exercise routines during COVID lockdowns, and I was aware that my average BG level had ended up higher than before.
By the end of 2020 I had stopped bolusing, although I was still declaring food to the system.
In early 2021 I stopped even doing that, relying on the oref1 UnAnnounced Meal detection. I have not declared food or bolused since. My HbA1c went up a bit, but still stayed in the low 5%s. Even when I experimented with slower insulins.
The CV went up, and the TIR dropped. But still to reasonable levels.
However my time below 3.9 mmol/L went up. I’ll expand on this in the next section.
But the switch to a fully-closed loop has definitely reduced the workload, and during 2021 my endo and I agreed that even with the slightly “worse” clinical data the trade-off was definitely worth it.
By early 2022 things had kept improving. At the moment I think my use of Lyumjev has been instrumental in this, although I’ve also learnt and tweaked various things over time. TIR was heading up again, CV and HbA1c down. And it turns out the low range has been changing too.
Looking at the lows
This graph expands the information about time below 3.9 mmol/L.
- The same yellow line shows the time spent below 3.9.
- Then an orange line below that shows the time spent below 3.5.
- The blue line at the bottom shows the time spent below 3.0.
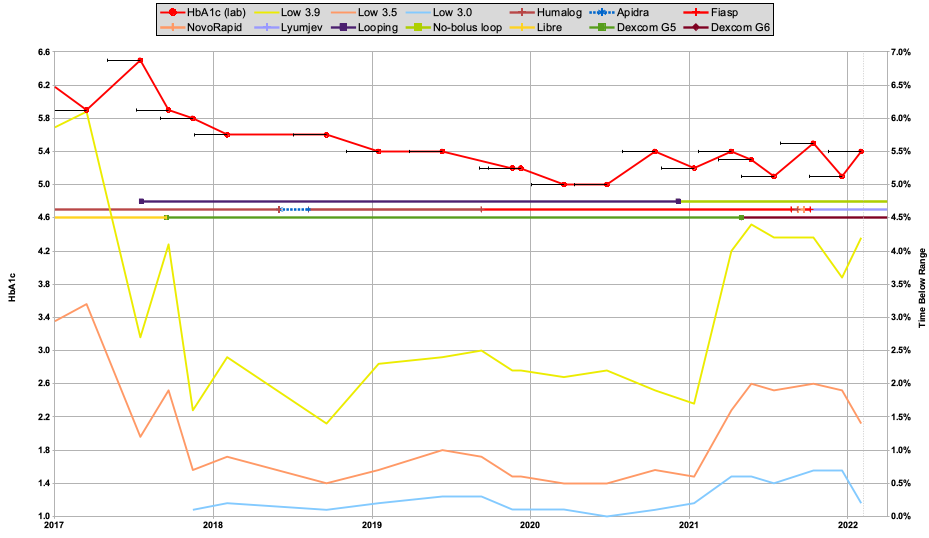
I’ve also added another horizontal line across the centre, showing the main CGM I was using. Libre up until late 2017, then Dexcom G5, and from early 2021 Dexcom G6. The Libre and G5 systems relied on frequent calibration against fingerpricks, while the G6 is largely self-calibrating (although I check things carefully both early and late in each sensor’s life).
After I went fully-auto, my “hypo” time below 3.9 mmol/L definitely increased. Interestingly the international recommendations on Time in Range are to keep that time to less than 4%. So not optimal, but at least not totally outrageous.
But that increased “hypo” time didn’t mean I was constantly crashing to actual hypos. In fact most of my time below 3.9 has been spent at either 3.7 or 3.8: where I’ve slowly dipped and then risen again. These don’t feel like hypos to me, although sometimes I do notice them.
But we can see the time below 3.5 mmol/L has increased too. Some of this has indeed been hypos while I’ve been living with and tuning the system. Some of it was tied into the increased CV: with wider swings around my target. Especially around exercise: one of the areas I’ve been experimenting with the management of.
But there are also issues with the G6 CGM reporting incorrect data especially in the first day while a sensor is settling in. To minimise this I overlap sensors (using two transmitters) where possible so I only start using the new sensor when it’s reporting trustworthy data. In the first day it can report dramatically-low (or sometimes high) numbers.
“Compression lows” are also a real issue, where sensors can report low values when the area is compressed. Sometimes by lying on it while sleeping, sometimes leaning on it on the sofa. Especially as the sensor gets older. Sometimes the G6 detects this and reports “Sensor Errors”, but even then a few spurious low values can make it through.
The G6 transmitter is physically flatter than the G5, but I feel that overall I’m seeing more compression lows.
Overall I am loving the Dexcom G6 system, but I won’t pretend it’s perfect.
Here’s the graph again.
The last points on the right of the graph are the first time I’ve had all the analysed days during Lyumjev use. They do show improvements in the 3.0 and 3.5 lines, although the 3.9 line hasn’t really dropped yet. But I have made some changes to my profile setup that should improve that in my next analysis: time will tell.
Management of the lows remains my main goal. I would like to get that below-3.9 mark down to 2% or lower again soon.
AGP – “Percentile graph”
My BG can bounce around a bit during the day, but when we average all those 75 days together we see what the spread has been:
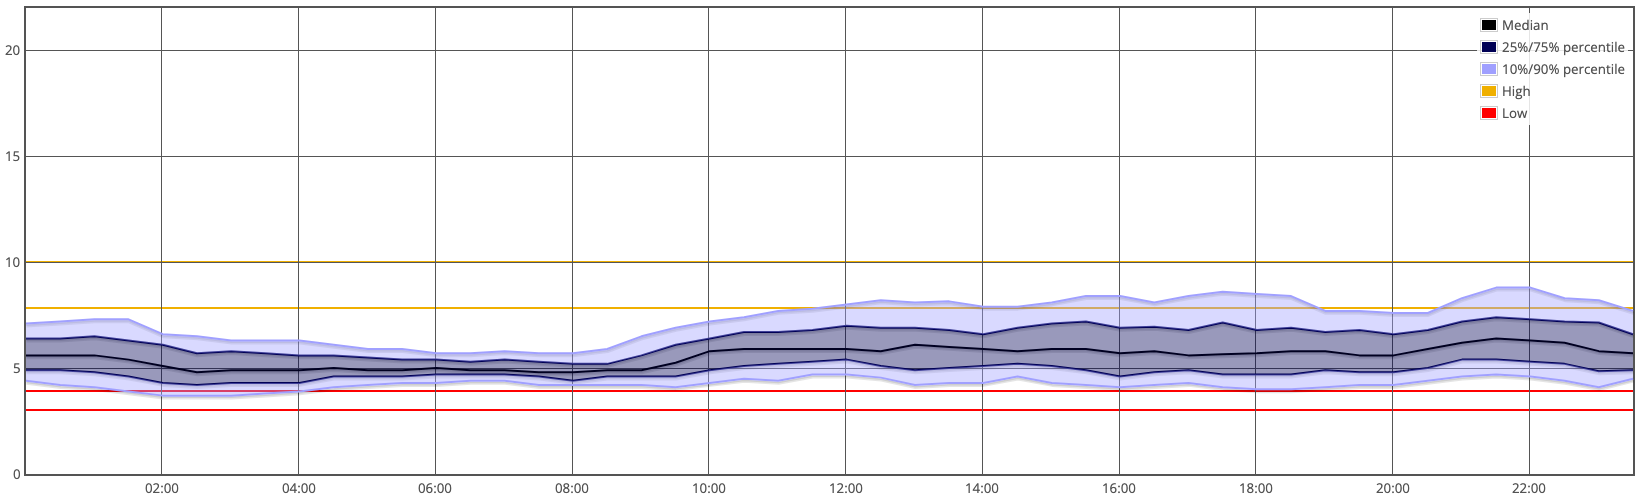
While the AGP graph can make everything look smoother and “flatter”, on any given day it can be bouncing around within that range. Especially when food is involved.
What HbA1c do we aspire to?
In early 2017 before I started looping I was dreaming of maintaining an HbA1c of around 6% (the lowest I’d ever maintained before) with the system taking care of much of the hour-to-hour work for me. Levels in the “non-diabetic” reference range of 4.4-5.6% seemed fanciful. Here’s the first graph again:
But then my HbA1c quickly dropped to 5.6% and below, and as you can see has now bounced around in the top half of the reference range for years.
I did get down to 5.0% in 2020, and safely without a high “TBR” (Time Below Range). But I was carefully counting all my carbs (and most protein). I was doing more work in managing my food than I had before looping, although no-where near as much as people who use techniques such as “Sugar Surfing”. Of course I was getting great benefit from it, and luckily didn’t feel the workload was oppressive.
With the move to a fully-automated loop in 2021 the HbA1c climbed a bit, but still stayed within the reference range.
The numbers in that graph have not quite yet improved to the level I had them in mid-2020, but they’re still at levels I’m happy with. And at the same time life is so much simpler.
The Pinnochio moment
 After decades of carb counting and manually balancing with insulin, not having to count food does feel like a fundamental Pinnochio “I’m a real boy” thing.
The workload in 2020 wasn’t oppressive, but now that I’ve experienced life without it, I don’t particularly want to go back there!
Interesting article. During the last 2 years of running Loop I have forgotten to bolus many times, for snacks and meals. When I finally wake up to the fact (sometimes hours later), I found temp Basals have kicked in and kept me in range. Since reading your article I have recorded the carbs on Loop but not given any boluses. It works really well. Stops me panicking about the predicted mountain of glucose Loop has to bring down. It will need tweaking, such as lowering my ISF and carb ratio. I also have edited the auto-bolus in Loop to .6 or 60%. To be honest after a week I haven’t used auto-bolus at all. It really has made managing my blood sugars a lot easier. Thank you. I hope others find it as helpful as I have.
Hi, I’ve discovered your blog recently and it’s very interesting.
I’m running a closed loop as well with AndroidAPS since 4 years ago. My quality of life have improved a lot but my HbA1C has been between 6.6%-7% exactly as it was before looping.
I also have the UAM enabled but I still have to introduce the carbs (specially on high-carb meals like pasta or rice).
Are you following a low-carb diet or any other kind of diet to achieve those results without counting the carbs.
Many thanks.
There are other relevant articles on this site such as “Yeah, but you’re low-carb” (hint: I’m not).
Mind you most of the time I’m “mid-carb”. I don’t usually eat large volumes of high-GI dishes like pasta/rice.