I recently wrote about the value of HbA1c in measuring more than just our average BG level. And in fact that it’s often not accurate in that. Our best tools for measuring our BG patterns at the moment are Continuous Glucose Monitoring (CGM) systems.
Basic data CGM data can show us is how much our BG has been varying, as well as how much time we’ve been spending at various levels. But the timeframes we look at this over are also important. This article is a brief overview of these issues.
Time In Range
To simplify things we generally split our BG levels into “ranges”, and there’s even an International Consensus Statement on Time In Range from 2019. The recommendations from back then can seem fairly conservative from some points of view, but it’s worth remembering that they are addressing a huge population of people who have not been able to reach those targets before.
For most people the classic “range” has been straightforward: 3.9-10 mmol/L (70-180 mg/dL).
BG levels below that are often classed as “hypo” and ranges above classed as “hyper”. By measuring what percentage of time we spend below/within/above this range we end up with these terms: Time In Range (TIR), Time Below Range (TBR), and Time Above Range (TAR).
Incidentally, a point of confusion sometimes is that “TBR” is also often used in the pumping world to refer to Temporary Basal Rate. But we’ll ignore that for now.
The general idea is that the more time we can spend “in range” the better. That means less time below range and less time above. Minimising the TBR minimises our exposure to hypo risks, and maximising the TIR then inherently minimises the TAR.
Basically, “staying within the goal posts” as much as possible improves our health probabilities.
Time in Tighter Range
Although that 3.9-10 range has been around for a long time, there is a growing push to prefer a tighter Time In Range definition. This was a topic at the 2023 ATTD conference (which I was able to attend thanks to the #dedoc˚ voices program). In fact there was a whole session with presentations about “Time in Tighter Range” (TITR). The range they’re using for this is 3.9-7.8 mmol/L (70-140 mg/dL). This happens to be a range I settled on several years ago for my own use so personally it’s convenient.
In that block of presentations the comments by the opening speaker were refreshing. He was talking about the example of interacting with parents of kids newly-diagnosed with T1D, who when presented with the TIR targets would ask questions like “So, if we stay within 3.9-10 we will avoid health complications?”
The careful answer might be “the clinical data shows that if you stay within that range you’ll reduce your risk of complications” but that can be too nuanced. People are often looking for yes/no answers so it’s easy to get pushed into saying “yes”. A direct quote from the presentation was:
“I don’t want to lie to parents any more.”
A lot of data was presented from Swedish paediatric populations claiming that targeting a tighter range (in this case 3.9-7.8) produced better long-term outcomes.
Interaction with HbA1c
My own experiences (outlined in 2019’s “Targets and Goals“) were that targeting 3.9-10 was a good start, but then improving how much time I spent in the lower part of that range (e.g. 3.9-7.8) had the side-effect of lowering my average BG. And thus directly lowering my HbA1c. And we know the evidence that correlates this with significantly reducing our risks of health complications.
In fact the risks fall dramatically as our HbA1c lowers (they climb exponentially above 7%). But there’s growing consensus that the risks the risks still fall as the HbA1c drops below 7%. Even the cases that show “only” halving the risks by dropping down to the 5%s seem significant to me.
Keep in mind that the reference range for HbA1c is generally regarded as 4.4-5.6%.
Ranges summarised
So, we have:
- 3.9-10 (“TIR” if no specific range is specified)
A guideline minimal percentage for TIR is often quoted as 70%, although more should be better. Someone without diabetes would generally achieve >98%. - 3.9-7.8 (“TITR”)
Because this is smaller and is contained within the larger TIR, we will never have a TITR percentage larger than TIR. But again, the more we can maximise the time we spend in this range the better. And the lower our average BG should be (compared to targeting just TIR). - <3.9 TBR.
This may be “below range”, but there’s a general recognition that (3.8) doesn’t necessarily constitute a medical emergency. It’s in fact still in the normal range of someone without diabetes. Sometimes the time <3.0 is also measured as some marker of “serious hypos”. Personally I try to minimise my time below 3.6 mmol/L (65 mg/dL) and track that as a statistic along with <3.9.
Now, there is a different range recommended for pregnancy..
I do know some people (male and female) who use that as their preferred goal all the time. I know if I looked at that range my stats could look even better (3.6-3.8 would suddenly be “ok”) but personally I’m not unhappy staying a little further away from hypo territory so have been sticking with 3.9 as my boundary.
Variability
Another easy metric we can extract from our CGM data is how much our BG is bouncing around. In other words how variable it is. Variability is generally measured by the “Coefficient of Variation/Variance” or CV.
Mathematically this is the standard deviation (SD) as a percentage of the average BG. A minimum target often mentioned is to have the SD be a third of the average BG (or in other words, have the CV be <33%). Measurements of people without diabetes have observed CVs around 17%, but managing that low when using subcutaneous administration of insulin can be a challenge for many people.
Reasonable timeframes
Of course we can sometimes get amazing statistics for a short time, but the meaningful statistics are when we sample over longer periods.
It can be exciting if we get something amazing like 100% time in range for a whole day. But the longer we go, the less likely it is to maintain 100%. But that’s OK: a “perfect” record can be unreasonable, and I prefer to just keep “good” stats instead of straining at getting “perfection”. I wrote about this two years ago in “Streaking“.
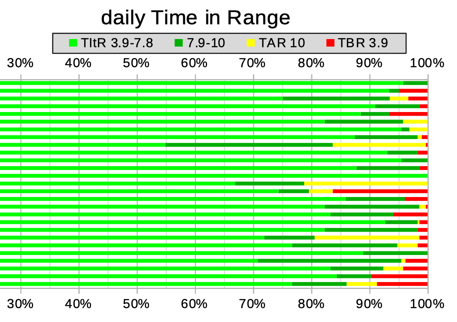
We can display this data in many ways. Consider this example, where the times below 3.9, up to 7.8, up to 10, and above are all stacked up to give a daily view:
As you can see, there are some days in there with 100% TIR (no yellow or red) and some with 100% TITR (only light green). There are also days where the CV (not shown here) was <15%.
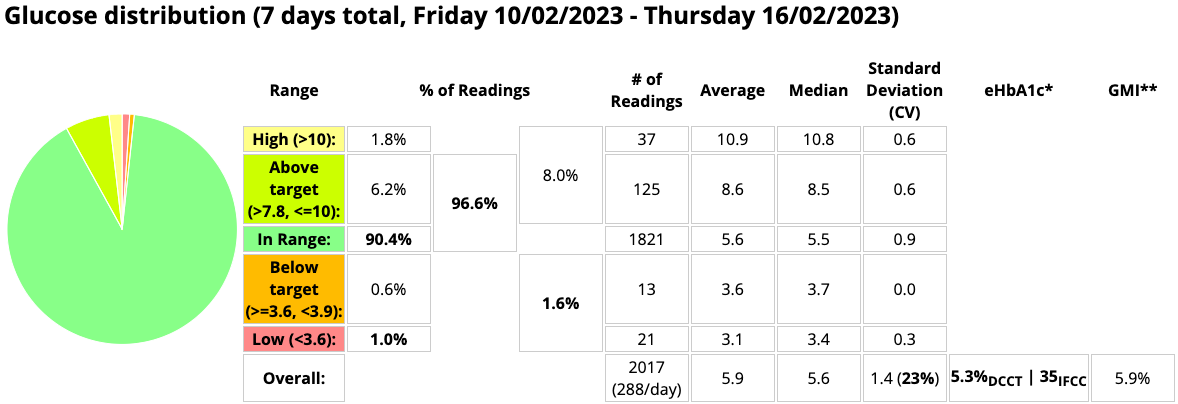
But maybe those are just “lucky days”: the overall average performance is probably more interesting for our overall health. If we just pick one week out of February we might see these stats:
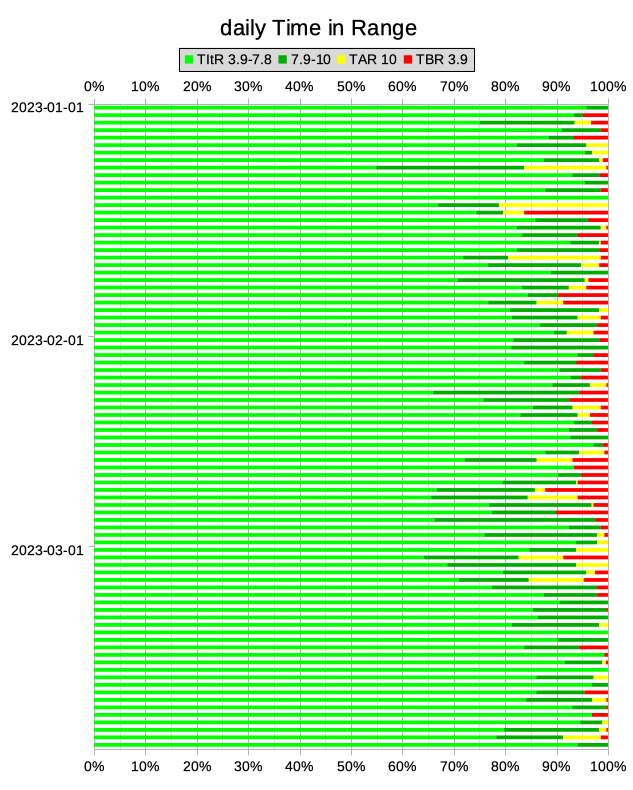
But if we average all of February we see this:

Although there were some 100% days in there, those clumps of red in the earlier graph have affected the overall stats. And it’s not only the time below 3.9 which has been affected: most of the other stats have moved around.
The longer the period we look at, the less it will be perturbed by variations. Traditionally a 3-month (90-day) sample period has been used a lot, as it approximates the relevant timeframe of the HbA1c blood test. But as I discussed recently, the significance of that precise period is a bit questionable. Especially as the older data has less impact.
In clinical studies there seems to be consensus today that the minimum timeframe to be considered is 14 days (as was used in the GMI study, and mentioned in the International Consensus on TIR). The reasoning behind that may include things like:
- It should be long enough to start to hide any obvious week/weekend 7-day patterns.
- Convenience (and impatience).
- Is it relevant that most commercial CGM sensors last somewhere between 7-14 days?
In analysing my own clinical history I have settled on two months (60 days) as my default timeframe, as it’s long enough to smooth out some of the variations in work/travel/life that affect me. I’ve also found the resulting eHbA1c data has a reasonable correlation with my lab HbA1c results.
I do prefer the 60-day summaries, but I’ll consider shorter intervals. Especially when evaluating recent changes to my management. Mind you, it sometimes feels like they might be measuring something unsustainable, so my preference is for longer.
Each time I see my endo I share with her data and reports for the last 60 days, but also for the last 14 days (so if it’s relevant we can talk about some specific example events and their impact).
AGP
We can also overlay all the days of CGM data in a sample to produce Ambulatory Glucose Profile (AGP) / Percentile reports, although these more guide us visually about our daily patterns rather than providing summarised metrics.
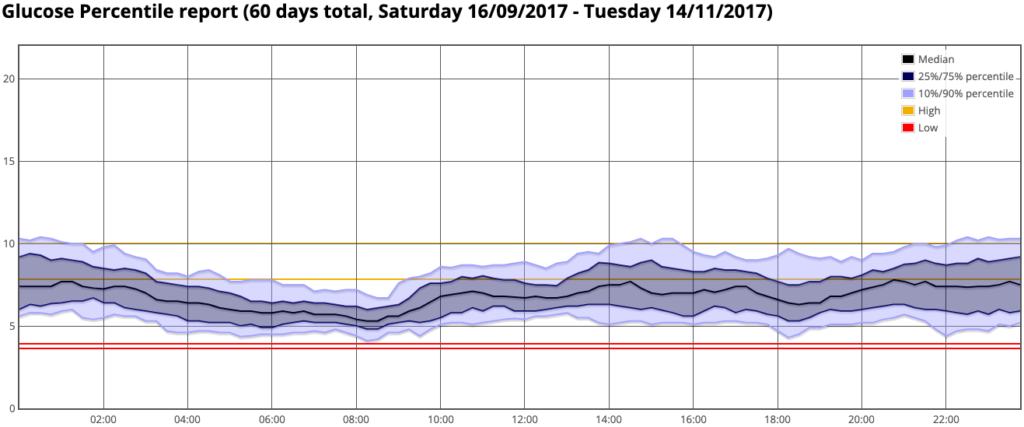
Do be aware however that if you’re moving across timezones during this period this can move your daily patterns around and disrupt these graphs.
Also note that the outer lines on this graph do not define the maximum/minimum values. They’re the 10% and 90% percentile lines, so at every point there have been 10% of the data above and 10% below them.
Those are baseline goals
I mentioned above the recommendations published in the 2019 International Consensus Statement on Time In Range. Unfortunately I have seen some people think those are end goals rather than minimal aspirations. They get to 70% and decide it’s not worth doing any better than that.
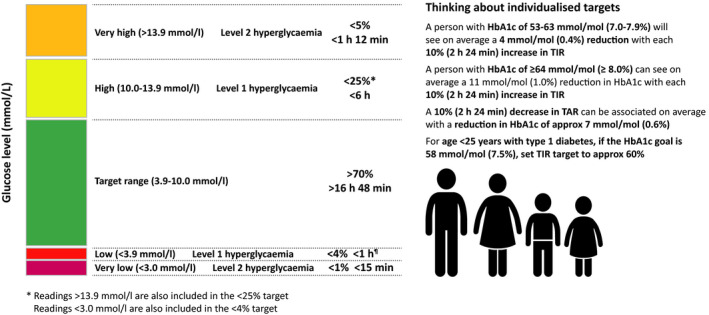
A graphic from “Time in range: A best practice guide for UK diabetes healthcare professionals in the context of the COVID‐19 global pandemic” shows this summary (plus some others for specific population groups):
As I mentioned earlier, I find it most useful to just concentrate on staying in the target range as much as possible. And staying out of the low range as much as possible.
I let the other numbers fall out of those two goals: I don’t closely watch the time above range for example. If I can improve the time in range, then the time above range should automatically improve.
So what goals should you be using?
Something that you are happy with. Maybe something that’s just out of reach so you don’t get complacent. Or maybe something that’s just within reach so you get positive feedback. It’s up to you. But hopefully something that’s going to help optimise your health throughout your life, and not going to add to burnout!
Keep in mind that the average person without diabetes would be getting much more TIR than 70% and less TBR than 4%. While we can’t necessarily expect to have an identical glucose profile to someone without diabetes, it’s hard to deny that the closer we manage to get there then the healthier we can be.
Of course, sometimes the “cost” of achieving better has to be considered in the context of the particular person’s life, but hopefully 70% is rarely seen as an end-point.
It’s not just about 70% in a particular range. At the same time it can also be about changing the range we pay attention to. The overall results can benefit as a result.
For myself (as mentioned above and described in 2019’s Targets and Goals) I started with 3.9-10. But once my AID system helped me stay in that range with repeated 100% days, over time I gradually started lowering the top end (giving a tighter goal range). The time-in-that-smaller-range was obviously less than for 3.9-10. After more months when I had managed to improve the stats, I moved the top end down a little more.
The mental adjustments included going from thinking “9.5 is OK: it’s still in range” to “9.5 is above where I want to be: I should do something”. Changing the CGM display so the coloured ranges were different helped impress that on my brain.
Obviously it also helped to have the AID technology on hand to actually do useful things about it.
So over time I was spending more and more time in a tighter band at the lower end of that initial 3.9-10 range. And not surprisingly that also meant that my lab HbA1c results consistently dropped, which was gratifying.
I could have also moved the bottom 3.9 up a bit, but there’s a bit of a psychological conflict there. It would mean more time further away from “hypo”, but it would also push the HbA1c up a bit. Eventually I settled on using 3.9-7.8 mmol/L (70-140 mg/dL) as my target range.
As I mentioned in that Targets and Goals article, setting the target too small too early can just lead to frustration at not meeting it. We don’t want to be discouraged from continuing, so I’ve always thought a staged approach is good. And even today my reports are still generated for both 3.9-7.8 and 3.9-10.
Percentages can sometimes be misleading
The Consensus Statement suggested that we should all try to keep our time below 3.9/70 to less than 4%. Sometimes those percentages feel like “just numbers”.
But if we do the sums we find that 4% means means just under 58 minutes each day. Let’s round it up to an hour. Which depending on your experience can sound either huge or tiny!
Also keep in mind that this is an average. It could mean half the days had no time below 3.9, but half of them had two hours! I know I would be happier with a much lower average. But I still have to accept that this might involve a few extended lows.
Trying to improve our time in “normal” ranges (whatever definition of “normal” we’re using) is good, although the difference between 75% and 80% can be hard to notice.
 But hypo territory is where small changes can become really significant. Whatever you’re dealing with: please try to stay safe!
Thank you very much for the great article