I have previously written about issues with DIA (“duration of insulin action”) and the values we use in traditional pumps and in loop systems. This is an exploration of some of the recent work on tuning my own loop that’s affected by this.
6 hours?
First, let’s look at a visualisation of the “Insulin On Board”, with three lines:
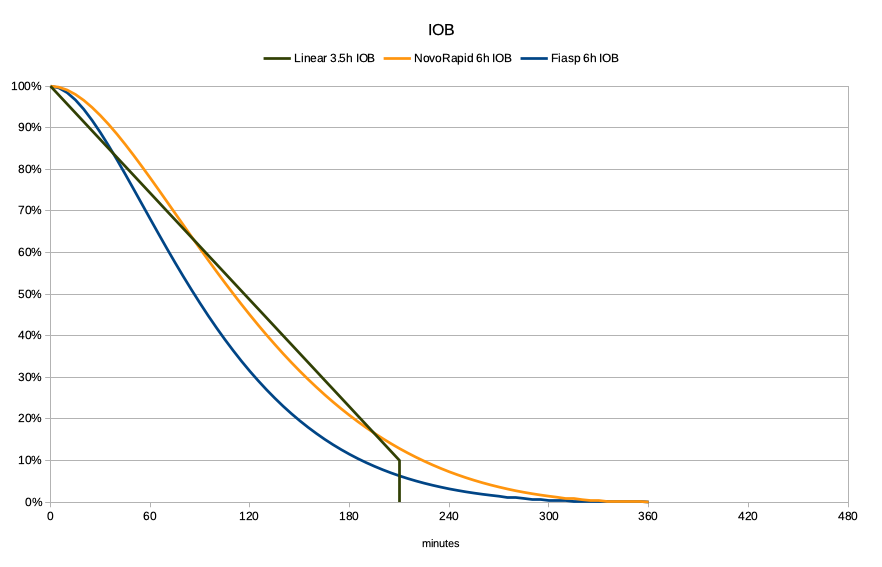
- The orange/yellow line is showing the result of AndroidAPS’s calculations for a 6-hour duration of NovoRapid or Humalog. The exponential curves have been modelled against the manufacturers’ trial data of insulin concentrations.
- The dark line is a traditional pump’s linear decay across 3.5 hours down to 10%, where it cuts off. 3.5-4 hours seems to be a commonly-used value for many people. For that time it does seem a reasonable approximation of that NovoRapid line.
- The blue line is the data used for Fiasp. It drops much more quickly, as more of the insulin gets used earlier.
Because in our loop systems this information is used to model the insulin not only from the occasional bolus (as in a traditional pump) but in fact from every bit of basal and bolus insulin, it’s important to know what’s going on in that “tail” out to the right.
Lots of little bits of insulin can add up, so those tails can have significant effect. If the loop doesn’t know that insulin is there and active it can think we need more, and bam we end up going low.
8 hours for Fiasp?
However, I (and quite a few others) have been finding that Fiasp tends to have a tail much longer than 6 hours. In my current experiments I have been having success at 8 hours, so that’s what I’ll illustrate here. I’ve gradually moved the declared duration out in half-hour increments, and the behaviour of my system has been becoming more predictable. But I know of one person in Europe who’s settled on 8.9 hours, so I might not be done yet.
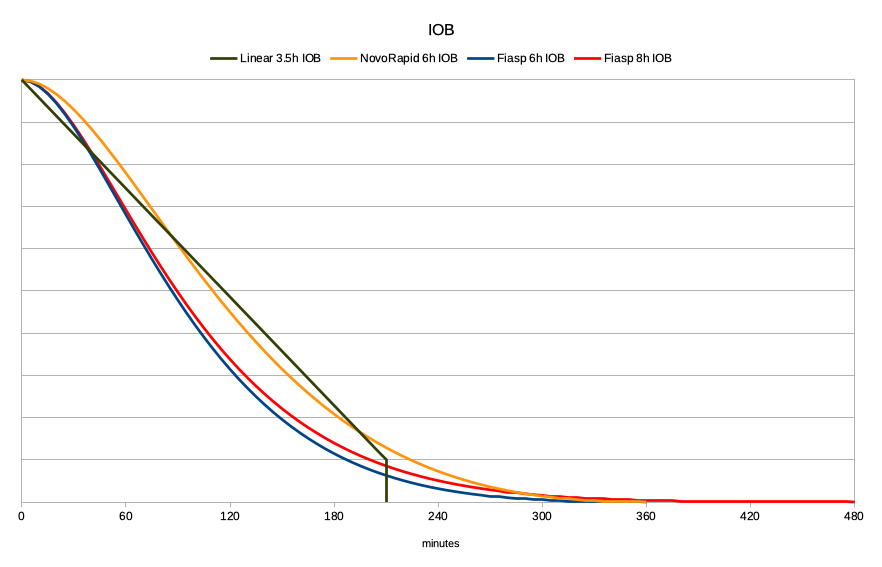
As you can see, that red tail out to the right is very thin, but it also results in changes earlier.
How long is the tail really?
The real-world behaviour of insulins is certainly not the simple linear model that bolus calculators tended to assume. This is is explored in Tim Street’s 2017 article which I linked from my earlier work. And if anyone’s looking for material in peer-reviewed medical journals about this it’s hard to look past the 2010 “Confusion Regarding Duration of Insulin Action” by John Walsh, et al.
The published documentation for Fiasp from clamp studies only shows measurements out to the 5-hour mark. At that point the concentration was low, and similar to NovoRapid. It seems that the study authors weren’t concerned with the details when it got down that low. But they were probably not dealing with closed-loop systems and thus concerned with the cumulative effect of “stacked tails”.
The study data certainly matches the behaviour of our models over the shorter timeframe, but we’re left to test how they match our real-world experience with the insulin over longer timeframes.
Active insulin rather than IOB
What I’m usually more interested in is how much insulin is active in me at any point rather than just how much is still “floating around”. Although that’s important for some calculations too.
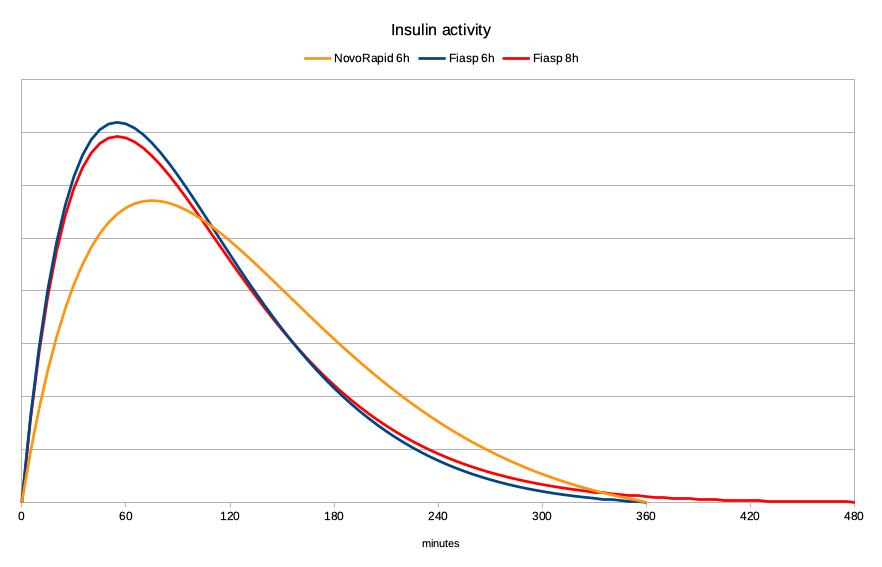
Using the same mathematical models, I’ve graphed the activity here. First for the NovoRapid and Fiasp 6-hour models:
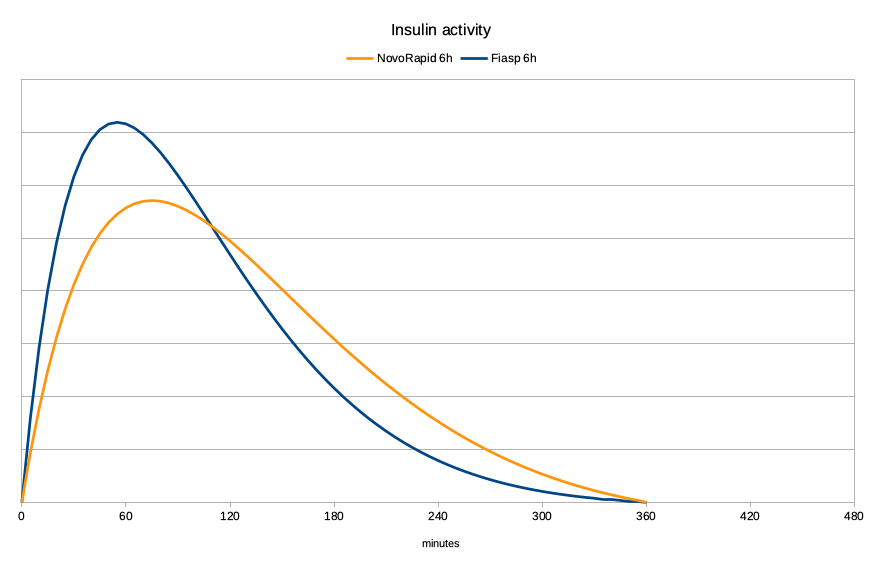
The peak for NovoRapid is generally accepted as being 75 minutes, with Fiasp peaking at 55 minutes. As you can see, the Fiasp becomes noticeable in effect much earlier, peaks, and then drops away. That “faster-on, faster-off” activity is great for a closed-loop system.
It’s sometimes easiest to think of the area under this graph as the insulin getting used up over time. The same amount of insulin is used in all the graphs in this article, so the areas should be comparable.
But let’s look at what happens if the Fiasp activity actually lasts out to 8 hours:
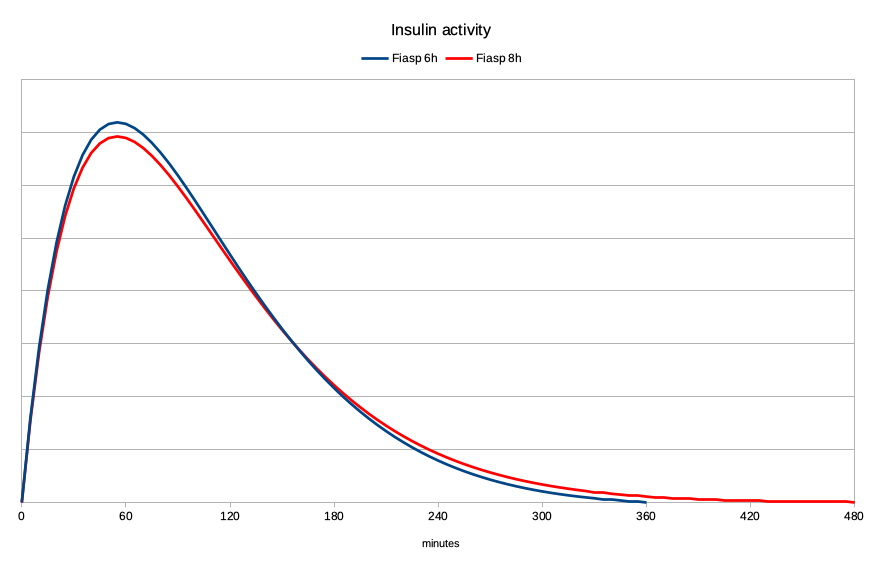
The peak is slightly lower, and there’s a significant increase in activity later. When we compare the levels against each other it becomes quite dramatic:
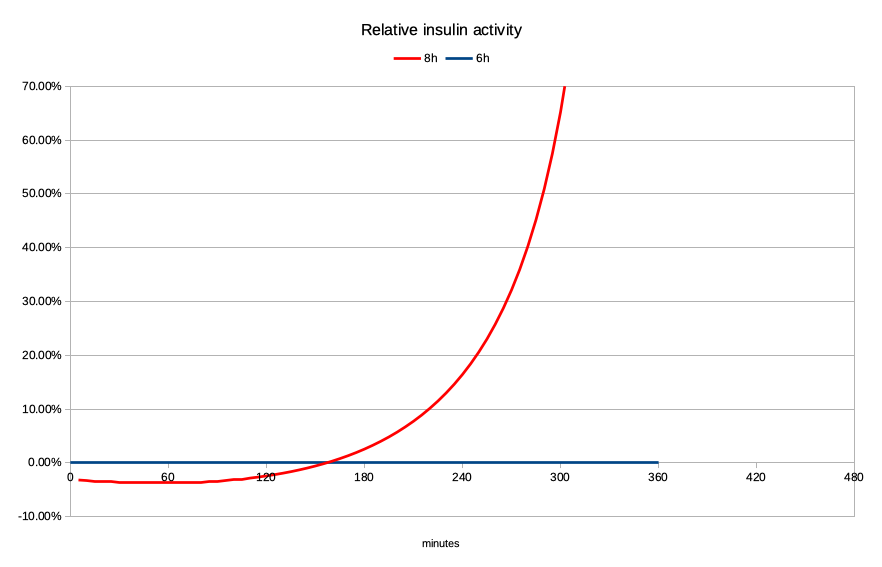
Yes as we get out to the right of the graph the activity levels are quite low, but proportionally it’s a huge increase. It’s double the activity when we get to 5-and-a-quarter hours, but it’s climbing exponentially by then. And when all those “tails” stack up…
The impact
By increasing the declared duration, the recognition that the later activity is much stronger does seem to make the system more resistant to unexpected lows many hours after a post-meal BG peak.
But I’ve also had to account for the decrease in activity over the first two hours. This has taken the form of a slight reduction in the insulin sensitivity factor, so the system knows the peak of activity will be lower for the same amount of insulin. I’ve also changed the insulin-to-carb ratio by the same amount.
These changes have allowed my system to retain most of its response behaviour as the declared duration has increased.
Of course, this isn’t a concrete statement of fact. It is based on extrapolations from the mathematical models (used by thousands of people around the world) and is still an experiment in progress. But those extrapolations have closely matched my real-world experience, giving me confidence in the scaling factors I’ve been using.
Welcome to life with diabetes.
Every day is an n=1 experiment in one way or another!
Hopefully this exploration of the logic is useful to other experimenters. Do note that increasing the duration past 7 hours does require an increase to the default limit in the AndroidAPS source code.
Just for completeness, here are the three activity lines on one graph:
A corollary to this observation is that some people have observed that they’ve had to tweak their insulin sensitivity setting when moving from NovoRapid/Humalog to Fiasp. From the relative heights of those peaks that does make sense to me.
I’ll say it again…
Lyumjev. The accelerated form of insulin lispro (or “fast Humalog”). I’ll keep mentioning it even though it is not yet available in Australia. But it is available in some other countries, and I’ve graphed here the model that people are having a lot of success with.
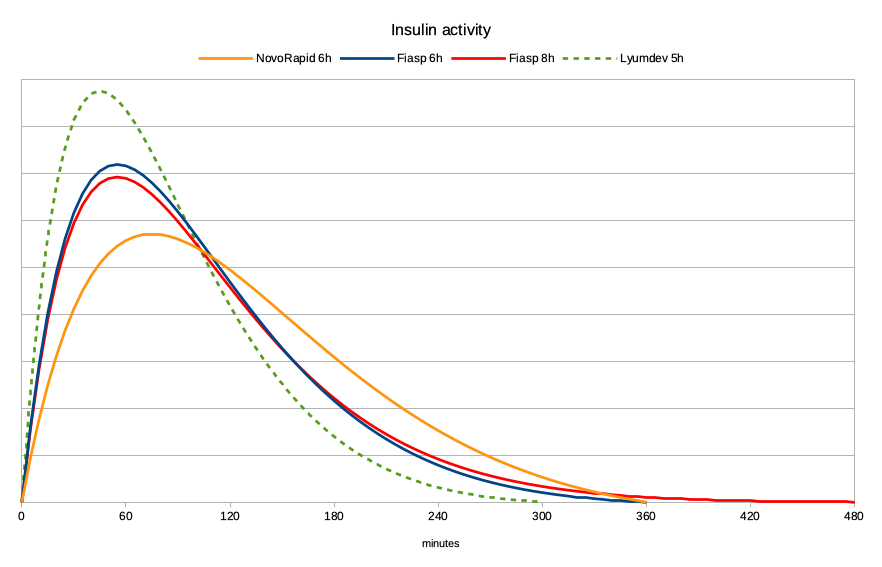
The peak is at 45 minutes, and the duration they’re using is only 5 hours. And as you can see, the resulting activity graph is impressive!
 The faster drop in IOB also gives us more flexibility in things like dealing with exercise.
Faster-on, faster-off, and without the super-long tail!
This is why we’re waiting for Lyumjev (and/or other faster insulins) with bated breath!
At least with Fiasp, #WeAreNotWaiting in the meantime and should be ready to take advantage of Lyumjev if and when we get access to it.
Thanks for the great information that you research and publish. Does the amount of insulin we take also have an effect on the duration of the dose, please? I am currently using Humalog in my Tandem T:Slim X2 pump with CGM. I’m expecting to get Contrpl IQ soon.
In a “normal” range of doses no I don’t think there’s much association between dose and duration. At least not with the fast-acting insulins.
Thank you David for your dedication and willingness to report your observations. You write that the graphs for these short-acting insulins are derived from manufacturers’ data. Firstly, how does one compare the one full dose injection from time zero (which seems to be what the manufacturers’ data is about) to the graduated insulin dosing of a loop system?
Secondly, early study of insulin curves show variation in height and timing of peak and duration according to the actual quantitative dose at time zero of short-acting insulins.
The lower the dose the lower the peak and maybe some delay in peak and the shorter the duration. I also wonder whether long- acting insulin follow not dissimilar variations.( as a personal observation I need to take Levemir 8 hourly in doses of about 5 to 6 units each time to attain an effective basal rate). Google: Endotext: Insulin – Pharmacology, Therapeutic Regimes and Principles of Intensive Insulin Therapy – chapter by Donner and Sarker Feb 2019 – refer to Pharmacokinetics section and Table 1.
Thirdly as the the above text points out in Table 1. – there are many factors, individual or in common, affecting insulin absorption and, as much a your graphs help illustrate the principles you espouse, the fact remains that each point plotted for a number of individuals is likely to be an average of a range of values and that needs to be divulged where possible. ( assuming of course drug manufacturers will give some information).
Finally, the race to be using an even faster acting insulin seems predicated on assumption that a high-carb diet is both acceptable and healthy. The intake of more readily absorbed and/or amount of carbs per meal predicates, according to some experts, higher doses of fast-acting insulin and a scramble to catch up with the carb-induced BSL peak. And these conditions, some opine, increase the risk of hypos and what I call the ‘hyper-hypo see-saw. Another expert opines that diet plays a major role in the increase in overweight and obese TIds (in at least the US, despite increased use of CGMs and slightly increased pump use over the 4 year study). Also to remember that the majority of TIDs are not using pumps or loop systems or even cgms (although subsidies in Oz seem to be helping an increase in CGM use). Otherwise a low carb diet seems to me to largely obviate the need for such ultra-rapidly acting insulins in the first place. Judicious correction doses of more rapid acting insulin and, in my own case, a combination of small amount of pre-prandial novorapid and larger dose of Actrapid in various actual ratios depending on the type of protein being eaten, does the trick.
To your first points, have you read the discussion of this in Tim Street’s article that I referred to?
As for your association of faster-acting insulins being predicated on and associated with high-carb diets. No. That would be you projecting.
Yes it allows us more options in our management, but it equally has its place in low-carb lifestyles too.
Agreed. I f anything, the use of Lyumjev in a closed loop with a low carb diet is better than the more traditional insulins for all the reasons you’ve stated that they’re better in a standard diet.
Having spent a month doing this, I can confidently say that it is very effective.
Faster acting insulin’s have their place in basal rates for pumps too. You can respond more rapidly to changes if need be.
And awesome for bringing down stubborn highs that happen for more than just carbs (stress, protein, etc etc)
There are a multitude of reports about high carb v low carb, high fat v low fat etc etc. Each to their own.
In the end, energy consumed vs energy used is the important factor… at least for me it very much is.
Again each to their own.