The HbA1c blood test is one that most people with diabetes are familiar with, at least to some extent. It measures the proportion of haemoglobin in our blood that has bonded with glucose, and is regarded as an indicator of your average BG levels over the preceding 3 months.
“What’s your HbA1c?” is a question often heard/seen online. Mind you, HbA1c only tells a tiny part of the story, and the question often seems to have a lot of parallels with judgemental questions amongst recent high school graduates such as “What was your ATAR?”
But it’s a result used in so many places that we can’t just ignore it. For example while CGM data can show so much more information about BG patterns and variability (including hypoglycaemia) not everyone has access to CGM technology. So doctors will keep referring to it.
HbA1c is usually related to average BG
A lot of work has been put in over the years clarifying a relationship between HbA1c and average blood glucose for the average “Caucasian” population. The formulas for this are well-known, and there are convenient on-line calculators.
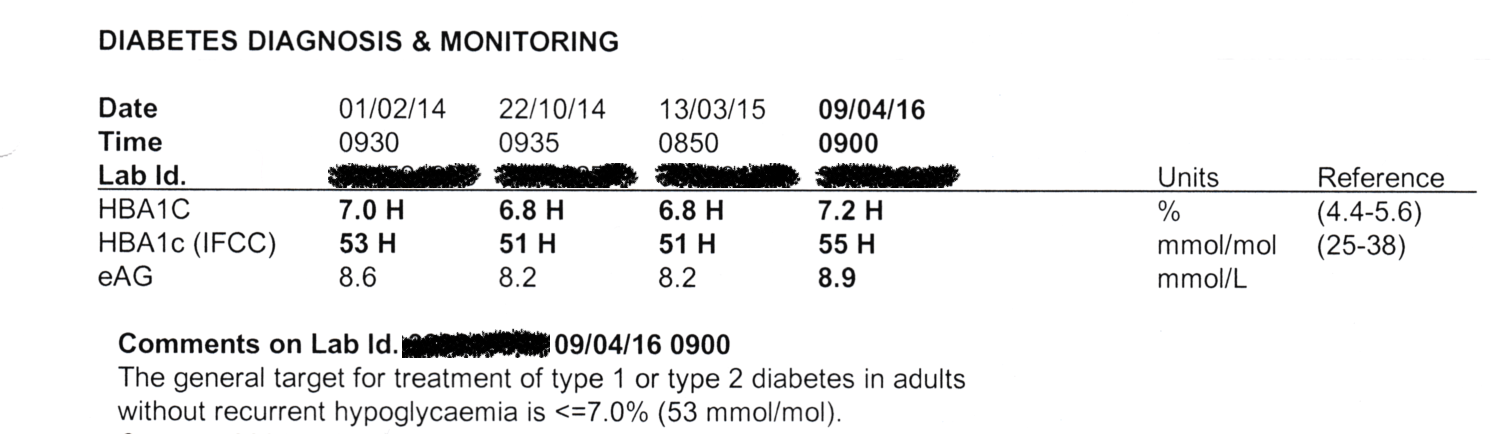
Printed pathology reports of HbA1c often include it in three forms:
- As a percentage (e.g. 6.0%). These are the “DCCT” units. Still commonly used, although officially Australia is supposed to be migrating away from it.
- In mmol/mol (e.g. 42 mmol/mol). These are the international standard (“IFCC”) units. In fact laboratory equipment often reports results in this, and in those cases the DCCT percentage is mathematically derived from it.
- An average BG (e.g. 7.0 mmol/L) calculated from the HbA1c value.
Actual averages preferred
![]() The online calculators (also used in various CGM software as well as BG meter software such as SugarMate, mySugr, and Contour) allow us to convert the other way, and estimate what the next HbA1c result will be.
The online calculators (also used in various CGM software as well as BG meter software such as SugarMate, mySugr, and Contour) allow us to convert the other way, and estimate what the next HbA1c result will be.
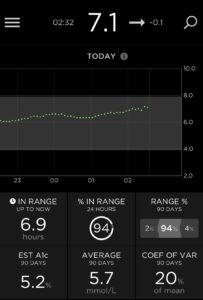 While some of that software uses fingerprick BG data to calculate an average, it should be obvious that the actual average that will affect HbA1c includes all the times you’re NOT measuring your BG, so a CGM that records a value every 5 (or even 15) minutes will record a much more accurate average. Especially if you only prick your finger at particular times of day, whenever you feel strange, etc. But we use what we can get.
Also the average over 2 weeks may be different than over 3 months, especially if there’s been a change in your BG management. But sometimes shorter timeframes can be very useful to give us a sense of what our current management would mean if we can keep it up long-term.
Predicting HbA1c from CGM data
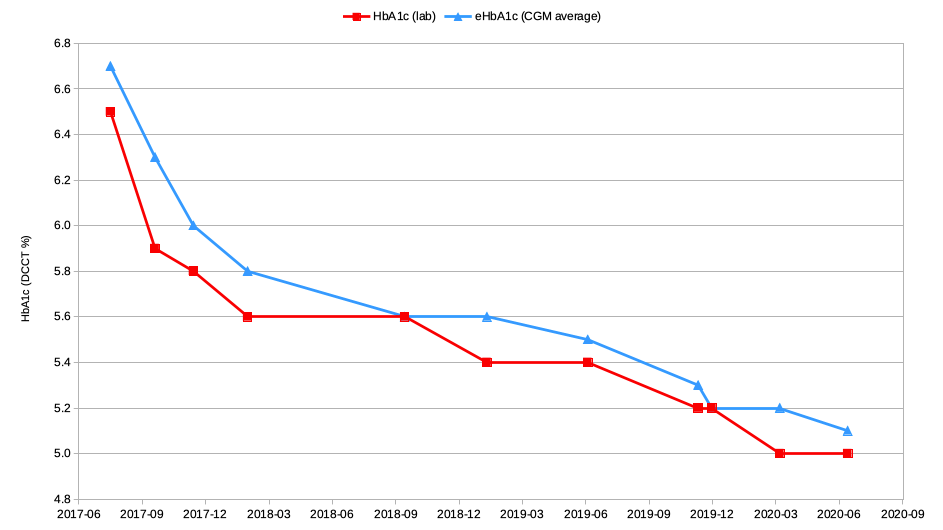
I’ve been using CGM systems since 2016, and the data gathered has allowed me to calculate the average BG (over the preceding 90 days) at various points and predict (or more-accurately: “estimate”) the HbA1c. This way when I go to appointments with doctors my HbA1c lab result is not a complete surprise.
As it turns out the lab results and the predicted results have usually been within 0.2 (in “%”) of each other for me. Some of the difference might be due to slight calibration bias in the CGM, but it’s been very small.
Keep in mind that the HbA1c numbers are only being reported to a precision of 0.1%, so there is room for rounding errors in these comparisons. Also it’s not clear that the actual precision of the lab measurements is always <0.1%.
I hear some people telling of massive differences for them between estimations and lab results. At least here I know a bunch of variables that have been removed, such as:
- I “loop” from my CGM data. I have a huge incentive to have my CGM accurate, as my insulin dosing is happening based on it.
- My CGM calibration is fairly accurate. When the calibration is off, I correct it. Any short-term errors from that should not significantly affect the overall data.
- I calibrate with BG meters that I trust the accuracy of. I compare my meters.
However, there is at least one point on that graph (in September 2017) where the difference between estimate and actual was more significant (6.3% vs. 5.9%). There seems to be a straightforward explanation of this, which I’ll get to below. But first some technical background…
A “better” estimation of HbA1c
The common algorithm for estimating HbA1c uses the average BG over the last 90 days. However this is a simplification and doesn’t perfectly match the haemoglobin aging process. It works well when the average BG level is reasonably constant over those three months, but that’s not always the case.
The average lifespan of a haemoglobin cell in most people is around 120 days, with them constantly getting replaced in the background. This means there are a lot more “young” cells around than older cells, so the HbA1c result is biased towards the more-recent BG levels. So if you’ve had higher levels in the last month, the HbA1c result will be higher than estimated by the usual 90-day average. And vice versa.
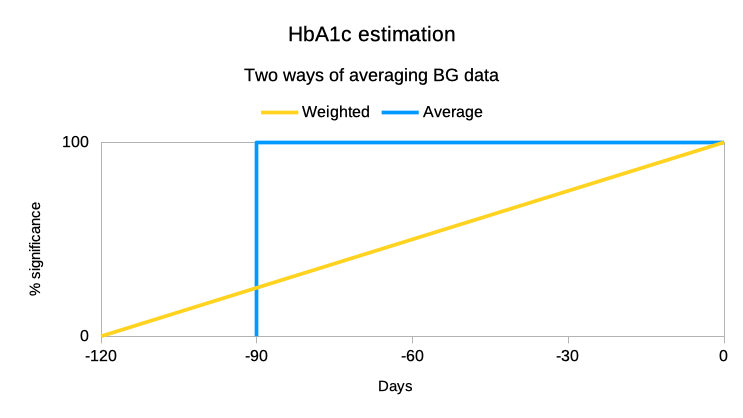
As shown in this graph, it is possible to scale or “weight” the older CGM data on a linear basis to build up a better estimate of the HbA1c. This is a better representation of the spread of haemoglobin ages in your blood.
In fact what I’ve done has been to just come up with a new “weighted” BG value, then fed that into the same BG->A1c formula. Reworking my CGM data that went into the earlier graph we get this update:
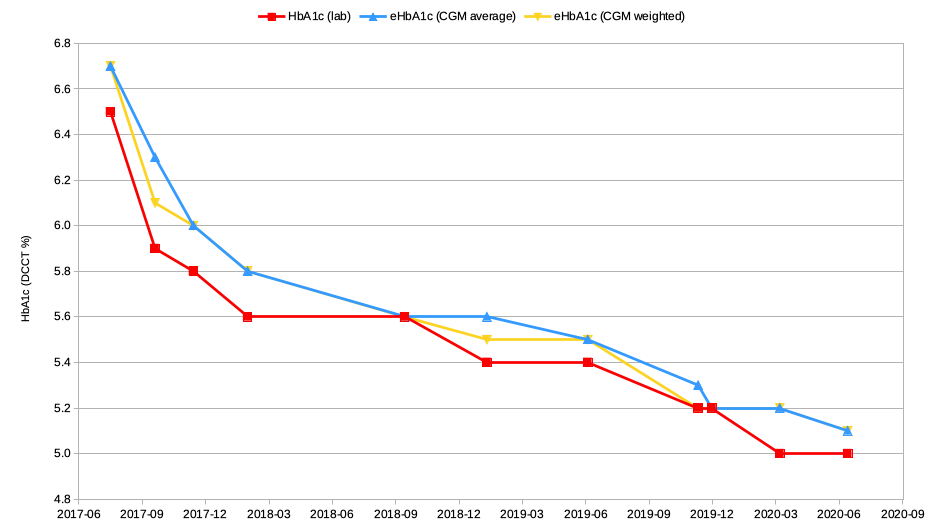
As you can see, the estimates are very similar. The simple 90-day average does a pretty good job. But let’s look at where they differ.
Remember that September 2017 result that was 0.4% lower than the estimate? August 2017 was when I started using a closed-loop pump system, and my average BG levels dropped significantly in fairly short order. So the blue 6.3% result would have been using about 2 months of data from before I was looping. But the yellow 6.1% result was within my usual 0.2% tolerance! It has put less importance on that older data.
The other places where the yellow (weighted) and blue (average) lines deviate do correlate with other times I’ve recently moved to lower BG values. For example September 2019 was when I started using Fiasp. The effects of that on my TIR and SD/CV can be seen in an earlier article.
At other times the difference between actual and estimated HbA1c for me has been 0.0-0.1%.
90-day average is “good enough”
Calculating the 90-day average is mathematically simpler than weighting all the data dependent on age. And estimations of HbA1c (“eHbA1c”) are just that. As can be seen in the above examples, when the BG management is relatively consistent the result is usually “close enough for jazz” (or as I learnt it: “close enough for government work”).
I’m not expecting that everyone should change their mathematical processes for something that might be slightly better.
But especially around times that there have been significant changes in BG management, we should keep in mind that the standard method can fall down a bit.
There are also other reasons for the relationship between average BG and HbA1c to differ (some of them genetic, some health issues) and I plan to discuss some of those in an article later in the year.
GMI
One last point, regarding the Glucose Management Indicator I’ve written about before. Here it is derived from the average BG data and overlaid onto the same graph.
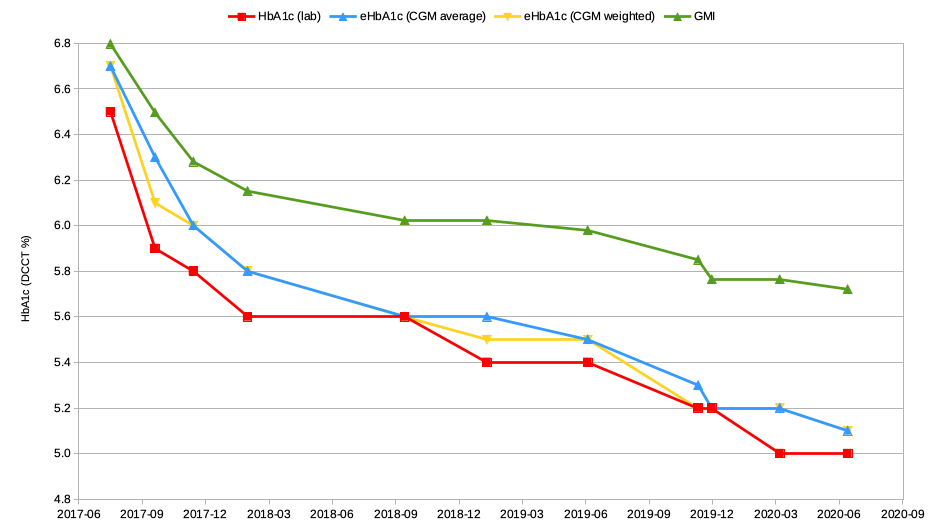
Because of the structure of the GMI formula, the relationship to HbA1c will be different at elevated BG levels. But it should be obvious why it’s hard for me to attach any value to the GMI as an indicator of anything significant.