I’ve written multiple times about the benefits of using different ranges for Time In Range (see “Targets and Goals“). This is revisiting that topic in light of some recent experimental data.
Like many this article has become quite long, but it’s split into sections:
- Terminology introduction, and choosing a new range based on published study data.
- What I changed.
- A discussion of the practical impacts of that.
- The benefits of viewing multiple CGM ranges together.
- The results.
- Checking my food intake.
I’ve provided links to each section, but each builds on the previous so hopefully you don’t just take the tl;dr option!
Terminology
As I wrote in “Ranges and Timeframes“, the clinical default for “Time in Range” (TIR) has been 70–180 mg/dL (3.9–10 mmol/L) for some time. In that context Time Below Range (TBR) is sometimes used to mean <3.9, and Time Above Range (TAR) means >10 mmol/L.
This is an illustration from the International Consensus Statement on Time in Range:
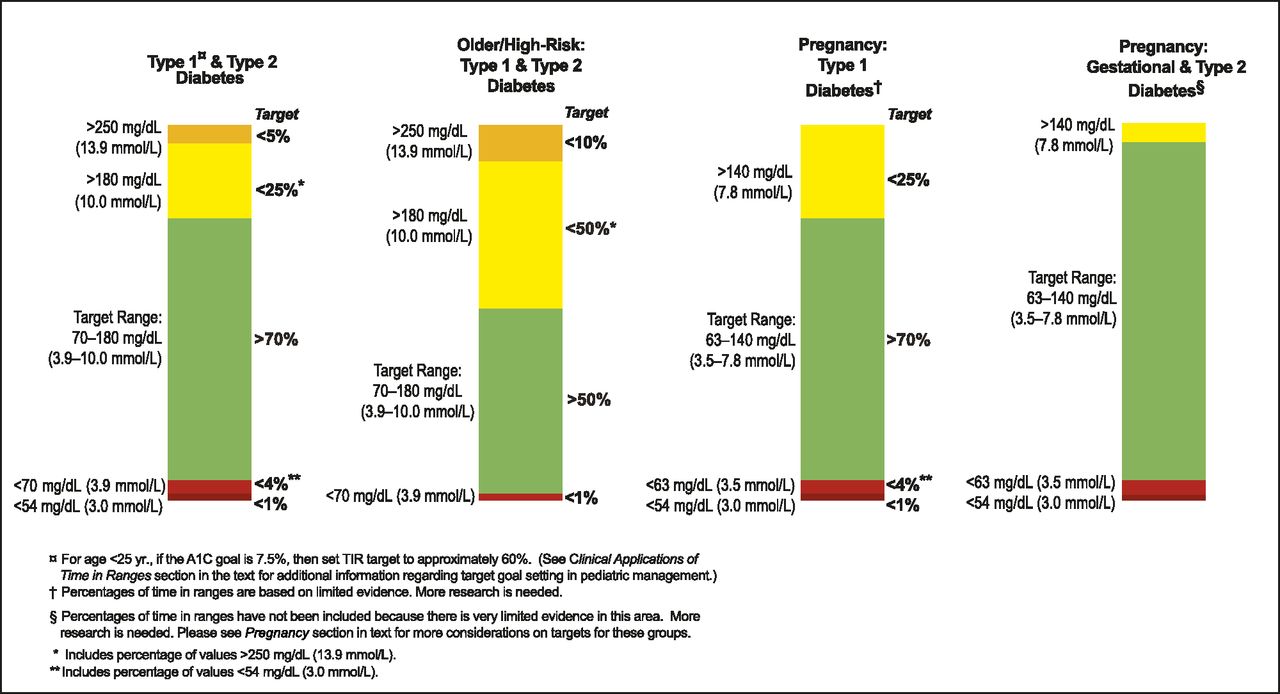
So if someone mentions a TIR value without specifying the range then confusion can reign. Especially as the pregnancy columns as shown use a different (narrower and lower) range.
Unfortunately a result has been that “TIR” has come to mean “3.9–10” (or “70–180”) for many people. Sometimes people round this off to 4–10 which does confuse things further (for example if someone’s BG is skating along and reaching 3.9 often but not dropping below it, the time in range can be more than slightly different).
I wrote in “Ranges and Timeframes” that some clinicians have started to use 70–140 mg/dL (3.9–7.8 mmol/L) as a tighter goal to optimise health outcomes, and are calling it “Time in Tighter Range” (“TITR“).
What about an even-tighter range?
Is that where we should stop? I’ve been using that TITR range as my goal for quite a few years now, and I’m sure it’s helped me. After enough time (and with the assistance of decent technology) it feels manageable.
A study in glucose variability in people without diabetes showed interesting stats for a a group of 153 people using Dexcom G6 CGMs (previous studies used older CGMs). Of course, most people were close to 100% in the 3.9–10 mmol/L TIR range, so it showed statistics for TITR as well as the 3.9–6.7 mmol/L range (which a few of us have started calling Time in Stricter Range or “TISR“).
This is an extract of data from that paper (although simplified by ignoring the inter-quartile results):
| Age group | overall | 6 – 11 | 12 – 17 | 18 – 24 | 25 – 59 | ≥60 y |
|---|---|---|---|---|---|---|
| n (people) | 153 | 27 | 30 | 29 | 41 | 26 |
| “TIR” 3.9 – 10 mmol/L |
98% | 99% | 98% | 97% | 99% | 97% |
| “TITR” 3.9 – 7.8 mmol/L |
96% | 97% | 97% | 95% | 97% | 93% |
| “TISR” 3.9 – 6.7 mmol/L |
89% | 90% | 92% | 87% | 89% | 81% |
| Over 10 mmol/L | 0% | 0% | 0% | 0% | 0% | 0.1% |
| >7.8 – 10 mmol/L | 2.1% | 1.7% | 1.2% | 2.4% | 2.1% | 4% |
| <3.9 mmol/L | 1.1% | 1.1% | 1.7% | 1.3% | 1.0% | 1.4% |
| <3.0 mmol/L | 0% | 0% | 0% | 0.1% | 0% | 0.1% |
| Average BG (mmol/L) | 5.5 | 5.5 | 5.4 | 5.4 | 5.5 | 5.8 |
| Coefficient of Variation (CV) | 17% | 16% | 15% | 18% | 16% | 17% |
Picking out the data relevant to me
Given my own age, I’ll narrow that down to the 25 – 59 column (including interquartile data ranges or SD where available):
| TIR | 99% |
| TITR | 97% (94 – 98%) |
| TISR | 89% (86 – 91%) |
| <3.9 mmol/L | 1.0% (0.3 – 2.3%) |
| Average BG eHbA1c GMI |
5.5 mmol/L 5.1% (± 0.2%) 5.7% (~± 0.2%) |
| CV | 16% (± 3%) |
I could summarise some take-aways from this as:
- The average was not 100% on TISR, TITR, or even TIR.
- Both TIR and TITR were very high, and TISR is where it started to drop off.
- Time below 3.9 ranged up to 2.3% (and not as the extreme, either).
Not a definition of “non-diabetic”
This was an interesting sample of a group of people without diabetes, and it does provide us with a reference point to compare with. It doesn’t serve as the definition of physiology without diabetes, but it does serve as an interesting example.
So what about us?
Is TISR useful to us?
At first glance 3.9–6.7 mmol/L might seem like an absurdly-narrow band. I’m sure people on super-low-carb diets might use goal ranges this small, but for someone used to not having such food restrictions it may seem like a fool’s errand to try to stay within that range.
However, we’ve seen that even people without diabetes don’t stay within that range 100% of the time. So aiming for that would probably not be sensible for us either (also see “Streaking“).
But as with TITR if we can increase the amount of time we spend in TISR, it has to lower our overall average BG, and should increase the values for TITR and maybe TIR. Those are all good things (as long as we don’t sacrifice quality-of-life to achieve them).
So what sort of TISR values can we achieve? Aiming at those example “non-diabetic” numbers may seem unreasonable, but we won’t know what we can do until we measure it.
One way to find out!
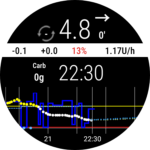
So in early April I changed the “visualisation range” on my Automated Insulin Delivery (AID) software (which also affects the display on my watch) so that anything above 6.7 would show as “high” (by displaying the number in yellow). I did not set alarms at that level, I merely changed the visual cues.
Before I switched from 3.9–7.8 down to 3.9–6.7 I looked at my data and realised that I was already spending 70-72% of my time in that range. Sure, a lot of that was while I was asleep and not looking at the numbers, but it was already reaching the 70% mark that the Consensus Statement gives us (for the 3.9-10 range). Nowhere near the 89% seen above of course.
If I’d only been achieving 50% in this range I might have hesitated to make the change, as it could end up being too frustrating.
Psychological impacts
 Most of the time I’m not watching my CGM display: my AID system is working to keep me on target. But I do glance at it every now and then. Like most people I do snack on food, and I know from experience that if I do this in an uncontrolled manner then I can find a while later that my BG has crested higher. The system does get me back in range eventually, but careless eating sometimes isn’t worth it. If I go high for a while because of something I ate, I’d prefer it to be worthwhile (special) food, and not just an impulse snack (e.g. too many biscuits).
So if I’m peckish I do sometimes look at my watch to see where I’m at and help me decide what I’m going to eat/drink.
I know from my 2018 experience that changing the “high” boundary can have a significant impact on my impressions of where I’m at. When my range was 3.9–10, if my current BG was 8.0 then I was “in range” and might tell myself that another biscuit wouldn’t hurt. But a week later when my range was 3.9–7.8, in the same situation I’d look at my watch and have a different reaction.
So I was expecting more of the same if I used 3.9–6.7.
Maybe it would affect my snacking choices. Maybe it would also affect other management decisions.
Was it a burden?
I think it’s important to not set the range too narrow too quickly. There will be a negative impact if most of the times we look at the display it’s telling us we’re out of range.
In the weeks after I set the smaller range, I did find I had an overall impression that I’d been higher than usual recently.
Occasionally things do shift in my management (my body’s needs change, CGM calibration can go off, pump sites can be bad, etc) so sometimes I can end up higher than usual, and it’s worth identifying and dealing with the issue.
But when I looked at the statistics I found that I was actually maintaining a similar TITR to before. That set my mind at ease.
The effects
I hadn’t changed other targets in the AID software: I’d only lowered the upper visualisation boundary, leaving things like my own behaviour as variables.
Every week or so I tend to review my data, and I did start to notice changes after a month or so.
- The TISR number went up a bit (meaning I was spending less time above 6.7). Still in the 70%s.
- So did the TITR (I was spending less time above 7.8).
- My TIR hardly changed. But it was generally above 97% anyway, so there wasn’t a lot of room to move.
Bottom line: it took a while to have effect, but I do think the slight psychological impact is worth the benefits for me.
Also if I end up eating a bit less overall that’s not a bad thing for me at the moment: I wouldn’t mind losing a few kg (as I’ve put some on over the last year, possibly associated with the lifestyle freedoms that my fully-closed loop has given me).
And as you’ll see below, this was just the start: after a few more weeks things settled in further.
But it’s a little more involved than just “moving the goal posts”. We need to consider how this is going to interact with things like exercise, and how we’re going to review the result.
Exercise
Managing exercise is one of the tricky things for us. Compared to a person without diabetes, we have a higher level of insulin in our bloodstream. This is because any insulin from our pancreas goes directly to the liver (where most of it is used) whereas when we inject/infuse insulin it travels through the body before getting to the liver. And with that higher availability of insulin near the muscles, in aerobic exercise conditions those muscles can use it to suck glucose directly from the bloodstream instead of preferring their own stored glycogen.
We usually manage this by trying to reduce the Insulin On Board (IOB) before we start exercising. And the most common way of doing that is by setting a higher temporary target a while before the exercise. This is used by both commercial and opensource AID systems. With manual pumping we might set a lower temporary basal rate.
By raising the target from my default of 5.0 up to 7.1 for an hour before (and then during) the exercise, the system will reduce the basal insulin inputs to let my BG rise to that point. That then gives me further to fall if there is a drop during the exercise, but it also reduces the chances of those drops due to the lower IOB.
But 7.1 will now be a “high” number! So by spending time up there I’ll be reducing my TISR. This seems unavoidable, but there are some important things to remember:
- The overall result averages are important. I’m not using activity targets every hour of every day.
- Exercise gives its own health benefits, even if our BG varies a little outside our preferred range.
- Setting a target of 7.1 mmol/L does not mean I will get to (or stay at) that level.
My BG might not reach it by the time I start exercising, and then depending on the exercise I can find my BG coasting along at a lower level.
The system will still put in a bit of insulin, so even with extended exercise I’m not at particular risk of DKA (and I have warning alarms triggered by extended periods of low absolute IOB as added protection).
Managing anaerobic exercise (such as weights work) adds further complications (as it tends to cause the liver to release extra glucose) but I haven’t been doing a ton of that lately.
It’s important to review multiple ranges
Although during the day I’m usually only looking at the graph with the 3.9-6.7 boundaries visible, when I intermittently review the results I’m not measuring myself against just the TISR number.
When viewing my results I see the TISR, TITR, and sometimes even TIR numbers. So I’ve written my reporting software to do this.
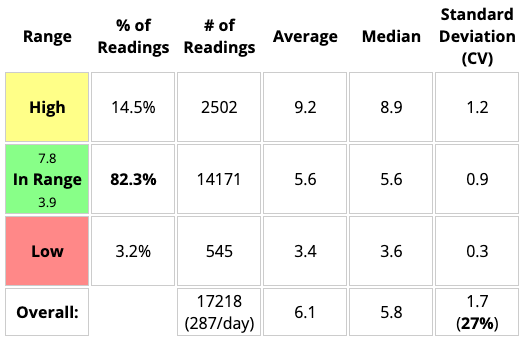
Consider the following examples of data from the start of 2023.
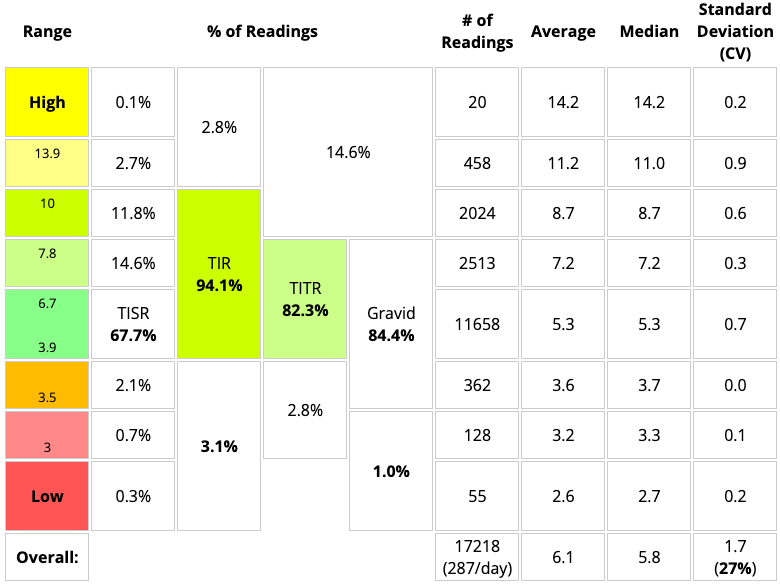
Looking only at the TITR block (82.3%) we see part of the picture:
But as in the next example, if we can see both the TITR block and the TIR block (94.0%) we see it in context. The 0.1% difference in this case is just due to rounding errors with the increased number of block boundaries.
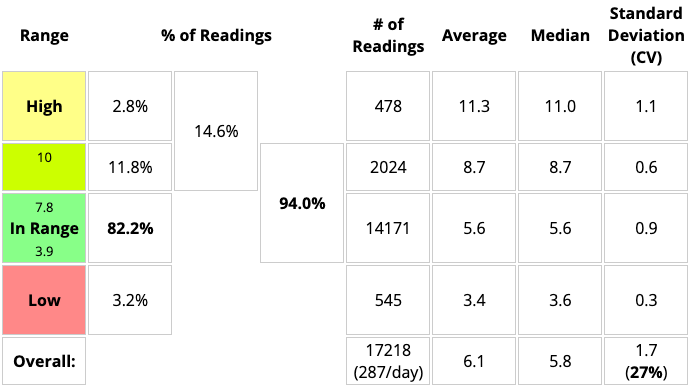
If I was only looking at the TITR number without considering the TIR, I might not notice if my BG was spending more or less time above 10 mmol/L.
In fact we can split it up into more and more blocks and see everything in context. There are a lot of numbers on this next example (do I really need to know the stats for the pregnancy/gravid range?) but I tend to just look at a few boxes most of the time.
All the boundaries used in the International Consensus Statement on Time in Range (see the diagram at the top of this article) are represented here, allowing easy comparison with reports from other software.
Incidentally, I’m hoping this enhanced report may be available in an upcoming Nightscout release.
The data shown above was fairly typical for me for a while, with around 95% TIR and 85% TITR a lot of the time. But that’s old data…
Has TISR given me a new normal?
I’ve now got used to having my visualisation range be 3.9–6.7 mmol/L. On reviewing my recent statistics I’ve found something which suggests to me that it was a worthwhile change!
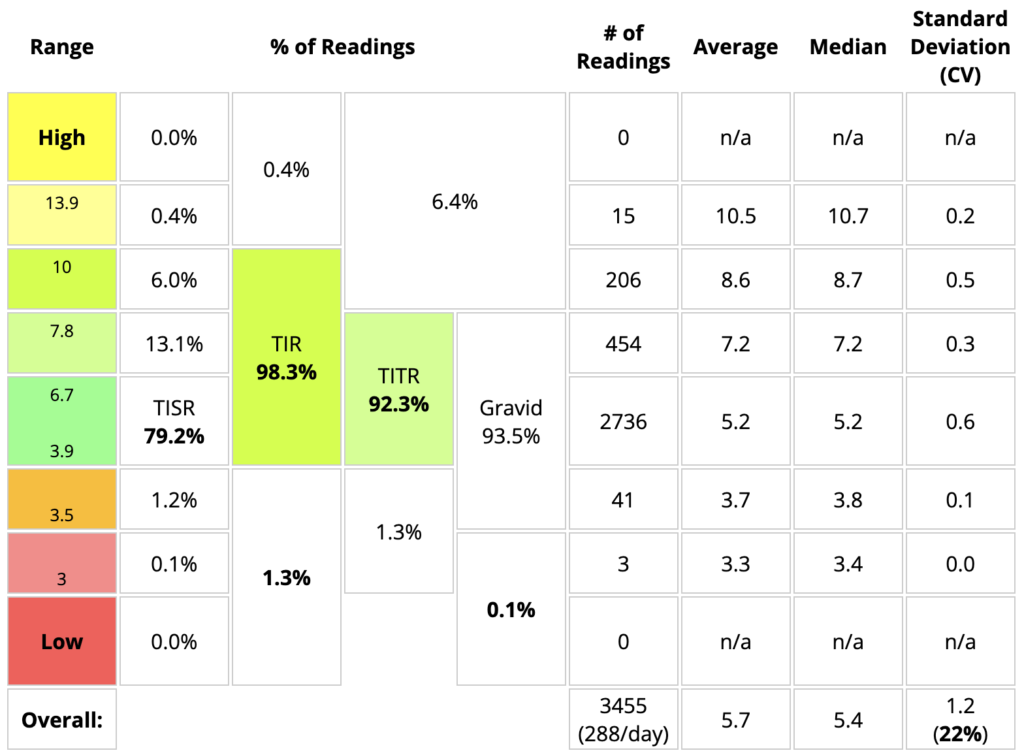
This is 12 days of data (and thus including two G6 sensors). Of course it’s showing almost 100% capture rate (288 samples per day) because I overlap sensors to avoid downtime. Actually 100% would have been 3456 samples.
Occasional fingerpricks were done and no significant CGM discrepancies were seen. I try to not just blindly trust my CGM.
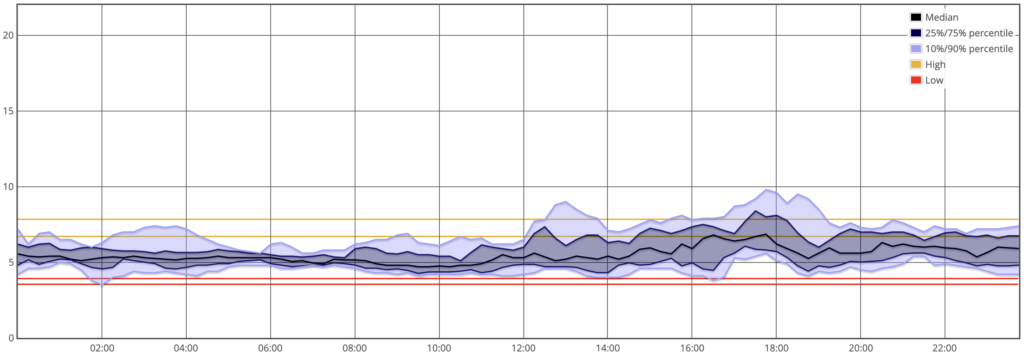
Here’s an “AGP” overview of the same period:
Comparing with my already-excellent results from March as well as that earlier example of “non-diabetic” data (with interquartile ranges or SD where available):
| David: March | David: May | “Non-diabetic” aged 25–59 |
|
| People | n=1 | n=1 | n=41 |
| Hours of CGM use, each | 504 (21 days) |
288 (12 days) |
192 (± 31) (3 – 10 days) |
| TAR (>10 mmol/L) | 0.8% | 0.4% | 0% |
| TIR | 98.3% | 98.3% | 99% |
| TITR | 89.9% | 92.3% | 97% (94 – 98%) |
| TISR | 74.7% | 79.2% | 89% (86 – 91%) |
| TBR (<3.9 mmol/L) | 0.9% | 1.3% | 1.0% (0.3 – 2.3%) |
| eHbA1c GMI |
5.4% 5.9% |
5.2% 5.8% |
5.1% (± 0.2%) 5.7% (~± 0.2%) |
| Coefficient of Variation (CV) | 21% | 22% | 16% (± 3%) |
Well waddya know?
- My TISR went up noticeably!
- TITR slightly less, but still noticeably.
- My average BG (and thus eHbA1c) went down.
- My time below 3.9 went up marginally.
From the report above we can see that almost all of that was dips “just over the border” down to 3.7 or 3.8.
Although it wasn’t my intent starting out, it feels like my stats are now almost “in the same ballpark” as those non-diabetic numbers! I’m not going to try to make them match, but they’re closer than I could have imagined a few years back when I set out to use AID in a “fully closed loop” configuration.
And quite importantly, I’m not feeling oppressed by the system regarding eating.
The major identifiable factor that changed between March and May was me changing the visible goal range on my AID system’s display. That’s about it. Plus “the winds of change” I suppose: this is diabetes after all.
It feels like a successful experiment.
Not every day (or even week) is going to be like this, but if it’s a sign of “a new normal” then I’m happy!
Not perfect
There was one event in this timeframe where the whole AID system was off for a while by mistake. Due to a confluence of conditions (what Shakespeare would call a Comedy of Errors) when it came back online several hours later the BG was in the 9s (and crested just over 10 before coming down). The CGM data is complete though.
There was also an episode with a shepherd’s pie (and again with leftovers the next day) that left my BG up around 7 for a few hours. And a few other “high” meals.
All of those took several percentage points off the TISR and TITR numbers when averaged across the fortnight (and increased the CV/etc). The data was looking dramatically even better earlier on, but that’s the point of doing a long enough sample that it’s more likely to represent “the real world”. As usual, I’ll see what the even-longer-term statistics look like when it’s time for my next blood test.
OpenSource AID for the win!
Note that this has been achieved with a combination of OS-AID (automated insulin delivery using the oref1 algorithm, as used in AndroidAPS et al), Lyumjev insulin (actually, during this period I was using the slower LH150) and a lifestyle that does not involve counting carbs, announcing food, or manual bolusing at all.
And some amount of physiological luck I suppose. I’m looking forward to seeing the results we get out of the Close-It trial (with a larger cohort and with different insulins) when it completes.
Also before anyone jumps to conclusions, this is not using an AAPS variant such as “Boost”.
“But you restricted your eating!”
Did I? My food consumption may have gone down slightly (ok, I should have checked before I started). Or maybe I just changed the timing a bit.
But I don’t feel like I’m especially constrained. I don’t feel like I’m “on a diet”, and I don’t think of myself as being on a particularly low-carb regimen.
I normally don’t count my food (haven’t as a regular thing since 2020) so I don’t usually have records of my carb intake.
But out of curiosity I fired up MyFitnessPal and logged all my food and drink for two days within this period. At the end it gave these tallies:
| Day 1 | Day 2 | |
|---|---|---|
| Energy | 9252 kJ | 8849 kJ |
| Carbs | 187 g | 154 g |
| “Sugar” | 104 g | 93 g |
| Fat | 116 g | 113 g |
| Protein | 99 g | 126 g |
| Fibre Not included in carbs of course: I don’t live in the USA |
27 g | 18 g |
This has reminded me I should probably sometimes eat a little more moderately, but that’s a different topic! It doesn’t seem dramatically different from the 193 g of carbs I noted in late 2021.
None of this food was from eating out (where guesswork would be needed). This was all stuff from the pantry, or packaged food with nutrition labels on it.
But does even 150 g of carbs in a day count as “low-carb”? I don’t think so. I’ve said for a long time I’m probably “mid-carb”. Except for on “party days”. I do know people who regularly consume a lot more though: that would have to challenge the system a little more more.
Now what?
Life goes on of course. I’m leaving my goal range set to 3.9-6.7, and I’m looking forward to seeing how the data develops in the long term.

I get your point very well for using the TITR or TISR …but I am still very sceptic about focusing on TITR for others…you are s especially “well treated ” person regarding the settings for your system..most of the people using hybrid closed loop systems struggle much more in different aspects (technical issues and finding the correct settings). To call for a TITR for people using this technologies brings along a lot of frustration and pressure. Quality of life gets really impacted by that – this doesn’t apply to you….but to a lot of others. So i am very careful with these options (and we should leave it as an option!)…never forget about “time in happiness” which should be defined by everyone personally (within the medical adviced range of course!) And I wonder if there is any measurable medical benefit to the TITR vs TiR ….
Medical benefits of TITR vs TIR is something that was being discussed at ATTD. More and more data is being gathered I believe.
It’s obvious that spending more time in the lower part of the 3.9-10 (TIR) range has to result in lowering the average BG (which flows on to HbA1c/etc).
The DCCT study decided that an HbA1c of <7% lowered the risk of health complications, but there's plenty of evidence that even lower HbA1cs can lower the risks still further. There is of course a point at which risks start increasing again, but it's certainly not 7%.
The boundaries of 10, 7.8, and 6.7 mmol/L are somewhat arbitrary, but we have to draw lines in the sand at some point.
I'm not trying to suggest that everyone needs to aim at the same goalposts I'm using. Finding the compromise that's manageable for each of us is important.
I do find it interesting that just by moving the goalposts I then observed actual change in the data.
Cheers. You’re living out the benefits of open source AID. Your notes from a lived experience show it’s not an impossibility to live a close to normal life as non-DMs. TITR /TISR are good & possible targets w/o so much restriction. Reality is, it takes time to fine-tune the right settings. It is also a matter of testing, timing, & making better choices. Congrats for your wins!???
Thanks for another great article about the stuff I am always thinking about. I aim for TITR as much as possible because sometimes my levels get away from me. My thinking is I should aim to stay as normal as possible and act asap to intercept highs. We dont have an insulin that works like endogenous insulin (I am MDI) that works as quickly and is no longer active as fast as endogenous insulin. I wish this was a thing! I think there are two reasons to distinguish myself from non-D ranges (3,9-10) though. Firstly, sometimes my BGL gets away from me and it takes much longer to get it back into range when it does. The second reason is that, yes on average people on a SAD way of eating are going above 6.7 BUT is that healthy in the long run? We dont have data one way or the other. Will all those non-D people be sicker when they are older? Plus all the literature about ROS, AGEs and the effects of hyperglycaemia. I am playing it safe for now.